
More Crashes: the Cost of Progress?
Can bike tech be called progress when the machines are getting slower and more dangerous?
The UCI World Tour injury database overwhelmingly shows that racing is getting significantly more dangerous. We also provide data that indicates bike design is the primary cause of more crashes.
Injuries at the UCI pro level have increased by 300% over the past decade. As shown in Figure 1, 2025 is set to break all records and end with a 400% increase over 2014.
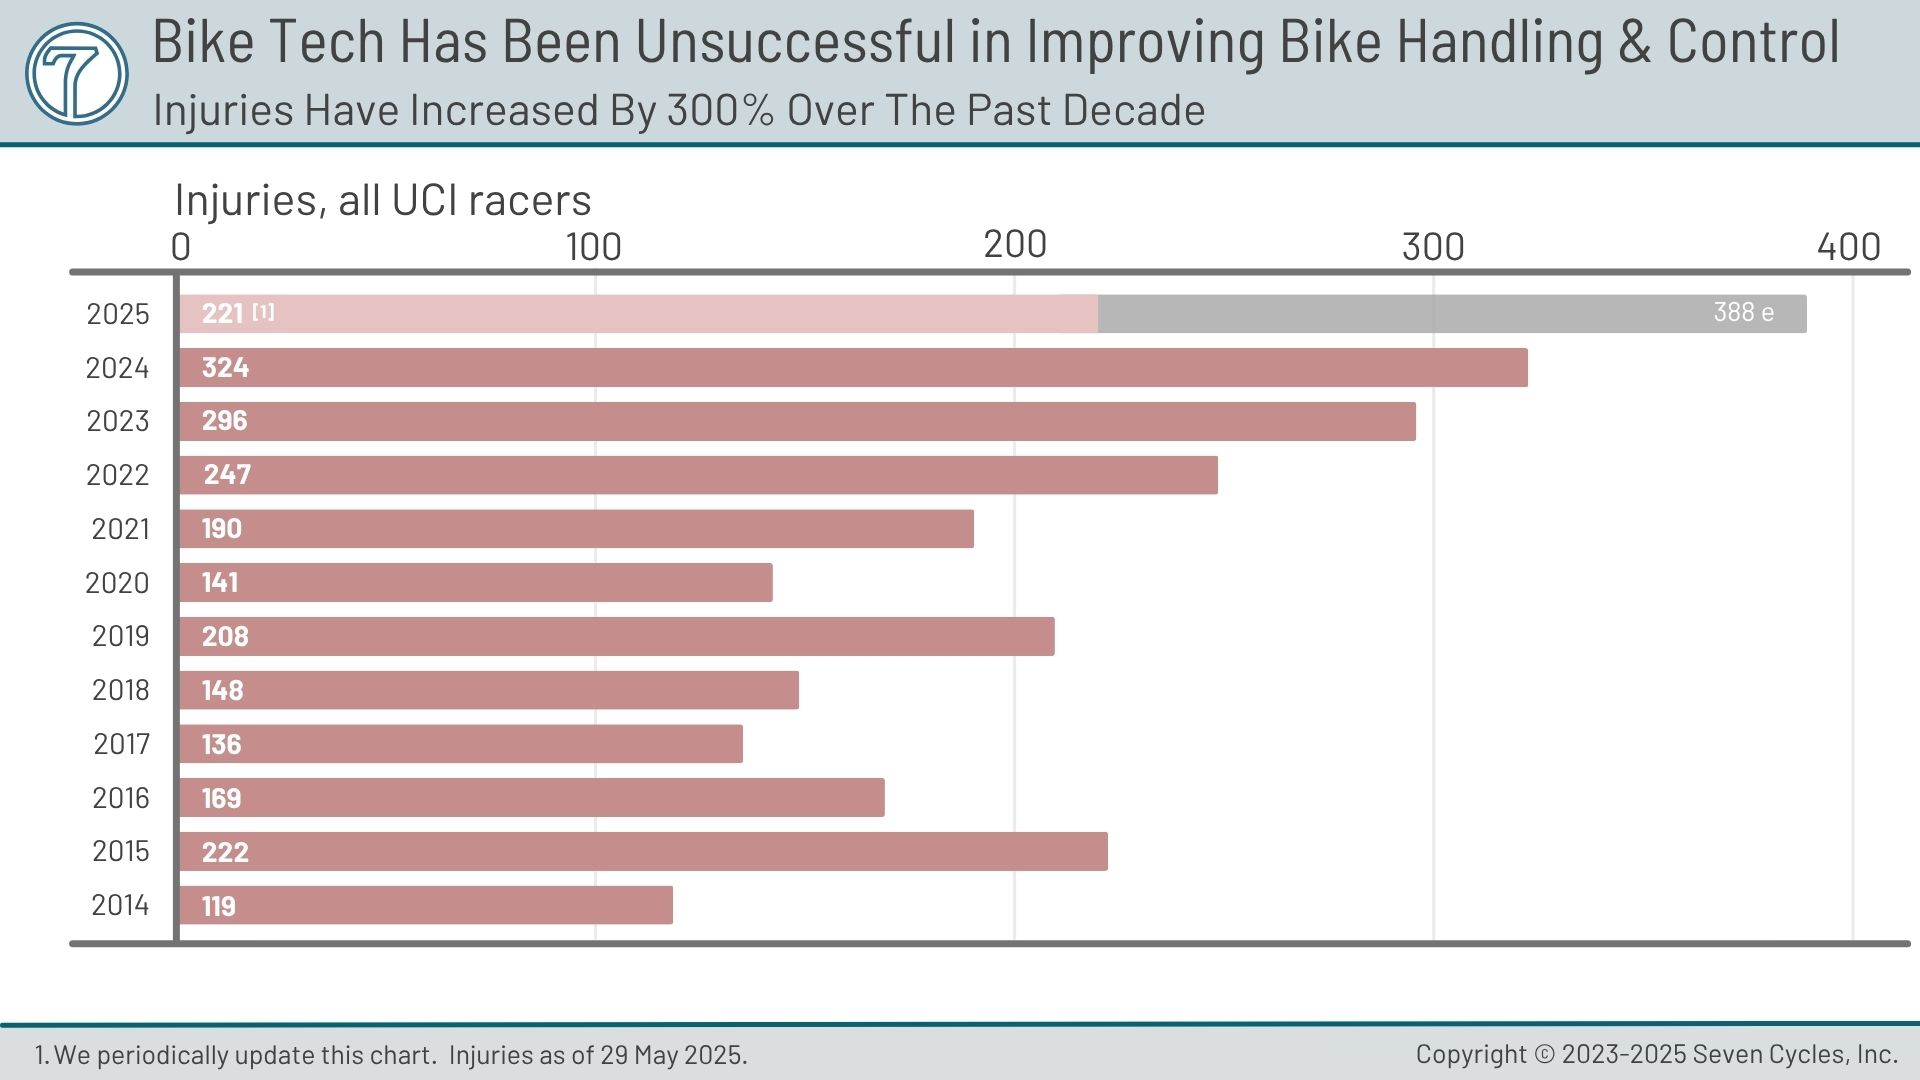
What is the cause of this three-fold injury increase?
The common crash increase mantra includes some subset of the following unfounded statements:
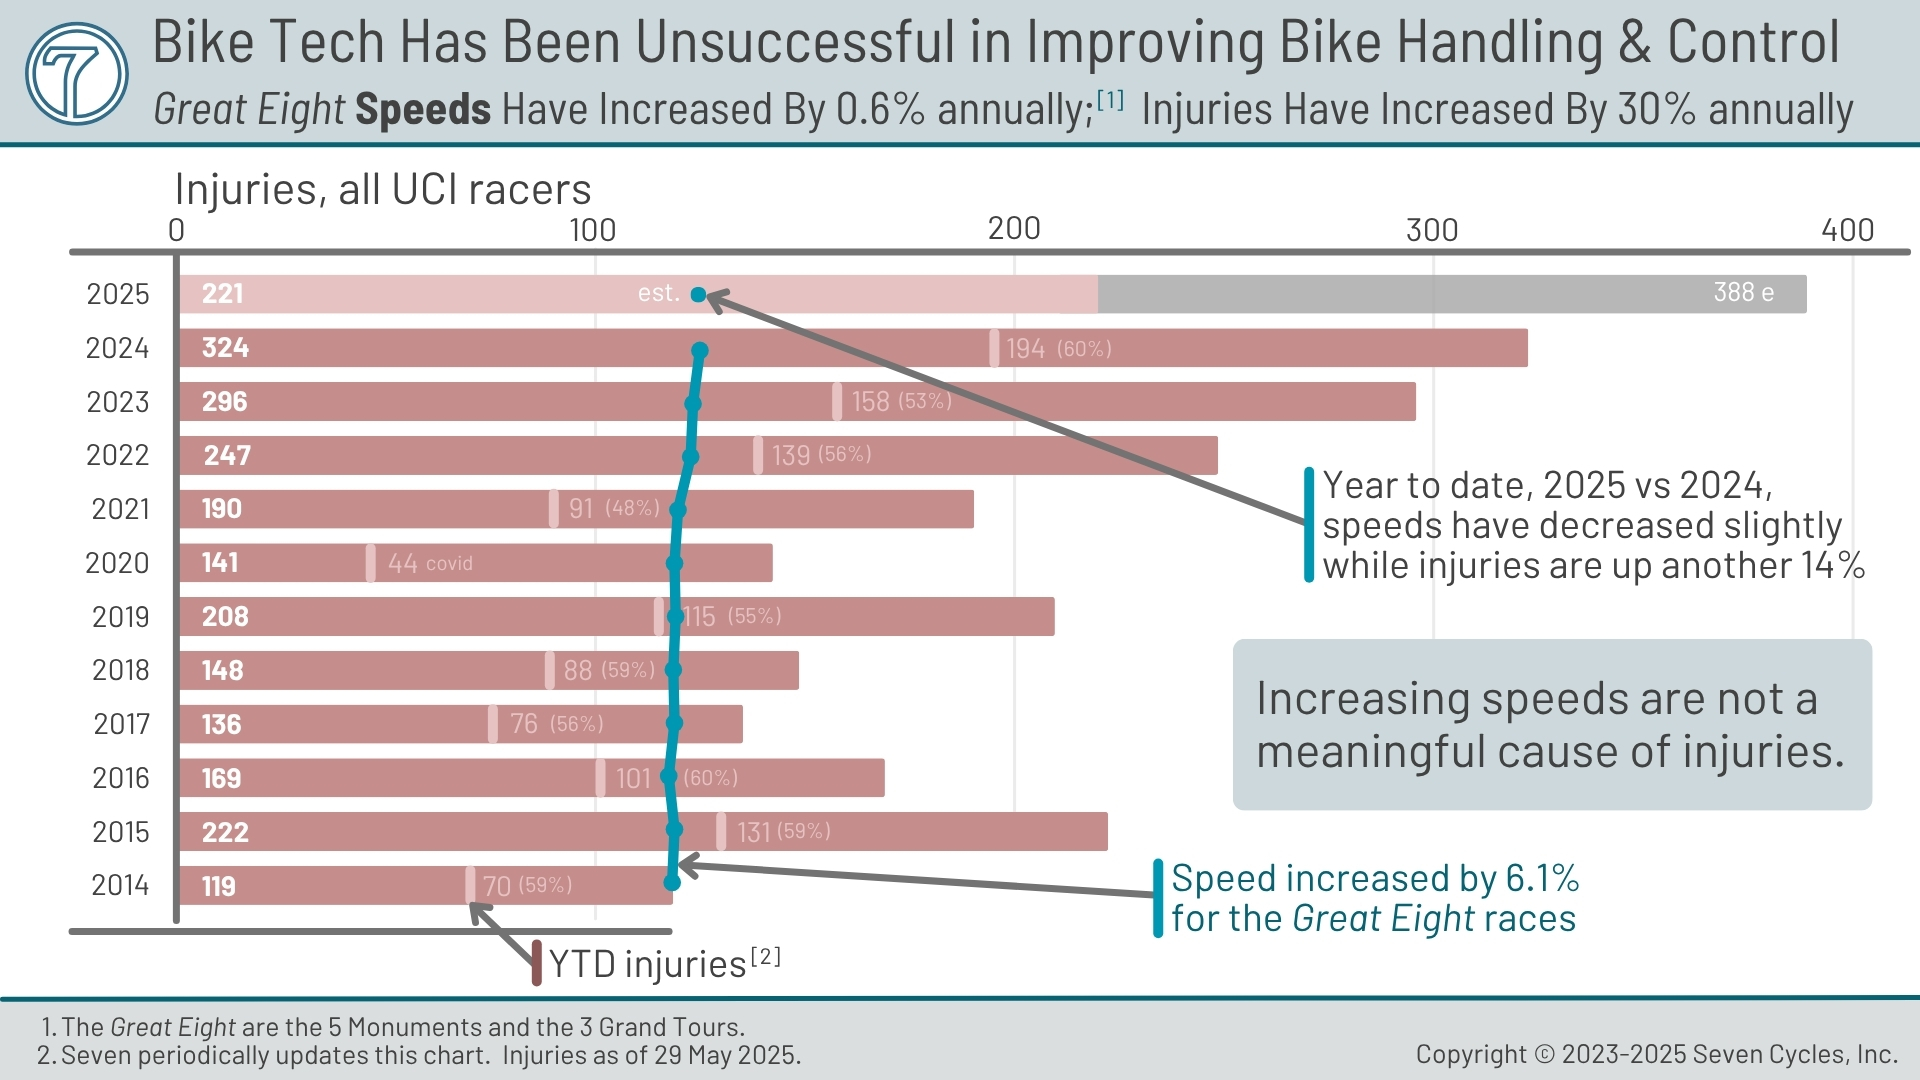
"Racing speeds have increased significantly over the past decade."
This is the most common reason we read for the rise in crashes. The data doesn't support that hypothesis. Figure 2 overlays the average speed to the number of injuries. The average speed increase in the top UCI World Tour races (the Great Eight) is 0.6% per year over the past decade. That's 0.25 km/h (0.16 mph) increase per year. That speed increase cannot explain any meaningful rise in injuries. Even if the crash-injury increase was exponential to speed increase, injuries would increase by only 1 to 2% annually.
The 2025 season provides more data on the disconnect between race speed and injuries. As of 2 June 2025, Paris-Roubaix, Milan-San Remo, and the Giro d'Italia were all slower than their 2024 counterparts by 0.9, 0.8, and 0.2 km/h each.[2] The net speed change for the four Monuments, year to date is slower by 0.1 km/h.[3] And yet, injuries have increased by 14% from 2024 to 2025 between January 1 and June 2 (198 vs 226 injuries reported).[4] Speed is not the cause of increasing injuries.
Additionally, the weather conditions in 2024 were substantially worse in 2024 for Liege-Bastogne-Liege and the Tour of Flanders.[5] Therefore, injuries should be higher for those two races. Paris-Roubaix weather was identical year over year, and Milan-San Remo weather was marginally worse in 2025.[6] The net rain effect should mean more injuries in 2024 than 2025. However, in 2024, the only Monument of the first four that reported injuries was Flanders.[7] Flanders 2024 weather was wet compared to its 2025 running, so this makes sense anecdotally.[8] The other three Monuments reported zero injuries.[9] In contrast, for 2025, the first four Monuments had a total 12 reported injuries despite better weather than 2024 for three of races.[10] 2025 has recorded a 300% increase in injuries for the four Monuments even though speeds were level and weather was better.
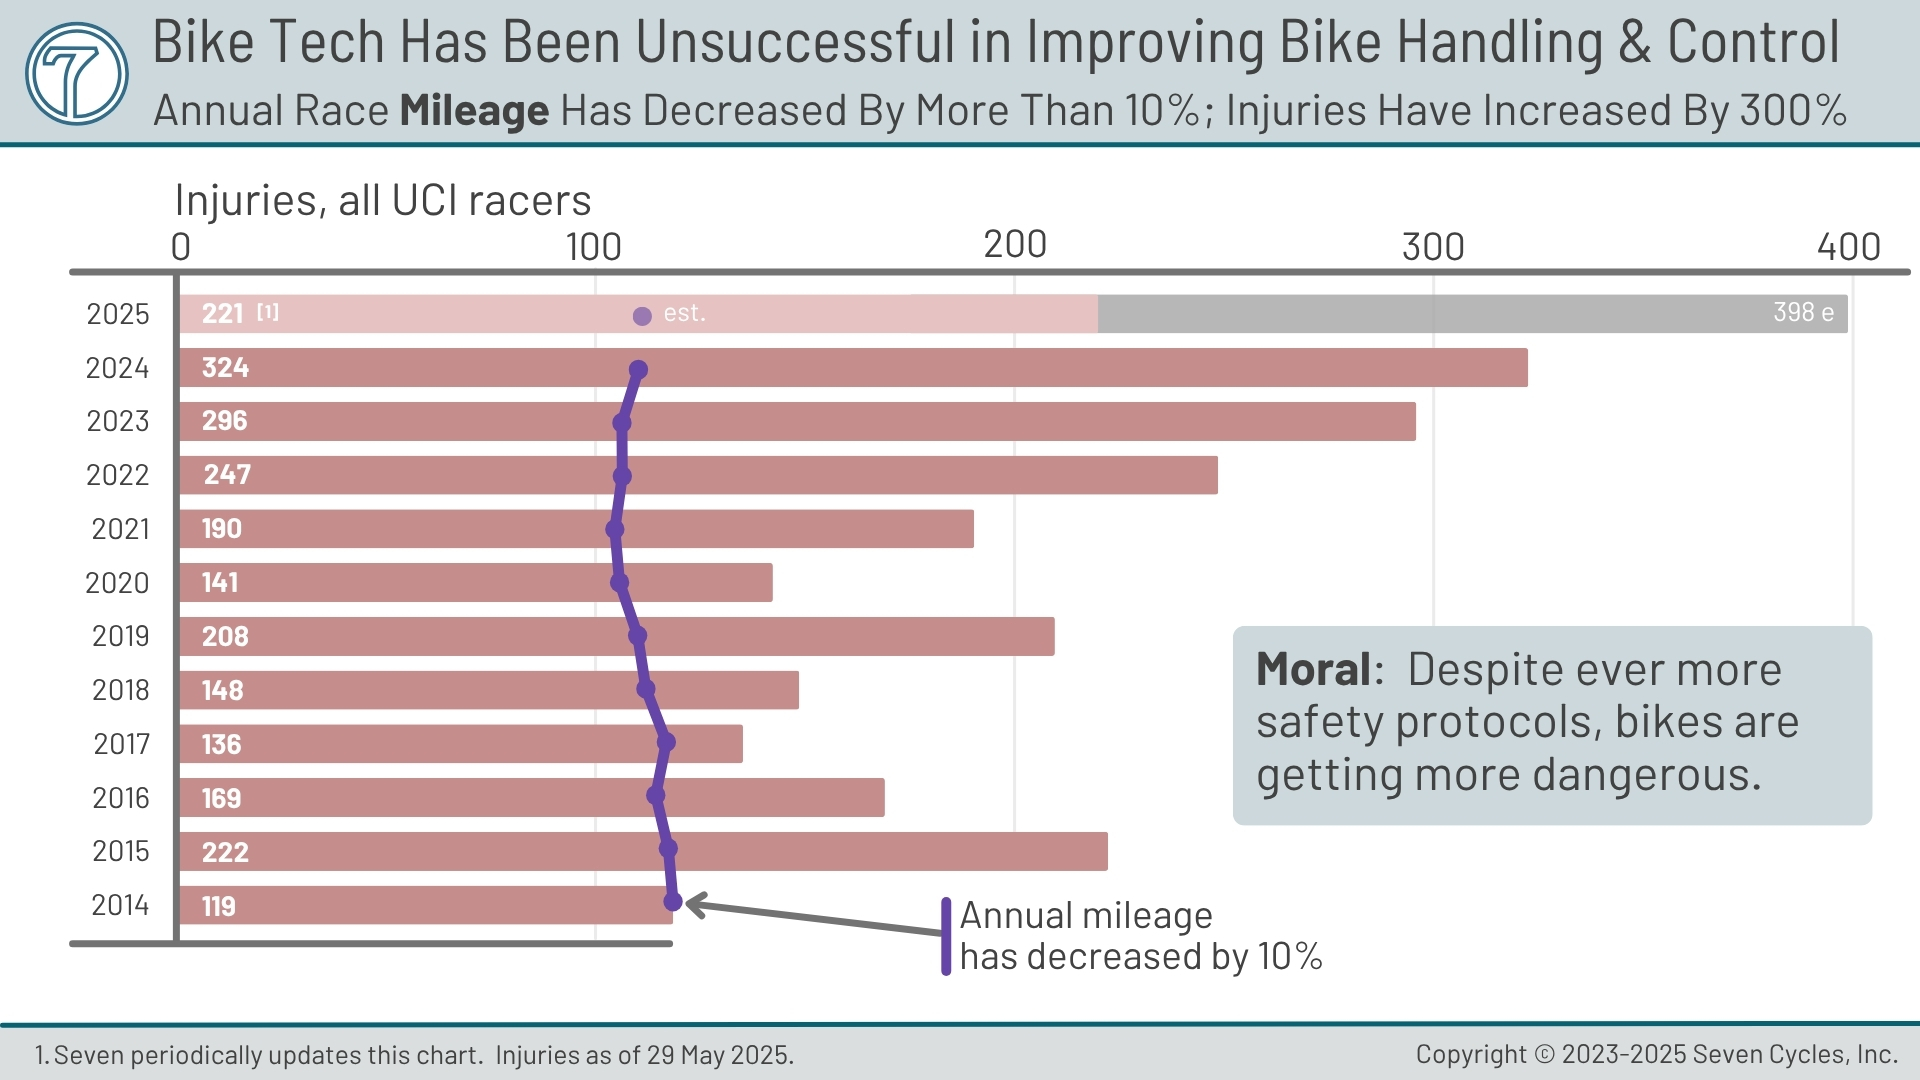
"Races are longer than ever."
We see this statement a lot, too. The average Great Eight race distance has decreased slightly, by 1.3%, over the past decade.
"There are too many races on the calendar."
This is another popular justification for the increase in crashes and injuries. In reality, the average number of races per UCI rider has decreased by 9% during the past decade (from 91 to 83 race days).
Figure 3 shows a combination of the total number of races and the distance of those races. There has been a 10% decline in total miles over the past decade.
"Traffic furniture is more problematic than ever."
This is true but it accounts for less than 9% of incidents in 2024 as tracked by SafeR.[12] Meaning, at most, 29 incidents in 2024. That's not a high enough baseline to account for a meaningful escalation of injuries.
"Tracking injuries reports more injuries."
The UCI's injury tracking system is obtuse. As the UCI has taken rider safety more seriously over the past few years, it probably affects the reporting of injuries. More focus on the problem likely means riders would report injuries. However, there are a number of counters to this argument. Regardless, assuming injury reporting is up, there's no indication that it's 3x up. Case in point: Primoz Roglic retired from the 2025 Giro due to four crashes.[11] However, zero injuries were reported for him.
Any other factors, like spectator interference, front-to-rear wheel gaps shrinking, and "all out" racing, have virtually no impact on overall injury escalation.
Data Sidebar: Ideal data would be crashes rather than injuries. There are significantly more crashes than recorded injuries. It is theoretically possible that the percentage of injuries relative to crashes is increasing. However, that seems unlikely, given that we are past the era of calorie deficit riding. Riders are stronger than ever and, therefore, less likely to suffer injuries than a decade ago. The number should be going down, not up.
Racing Is Significantly Safer Than A Decade Ago
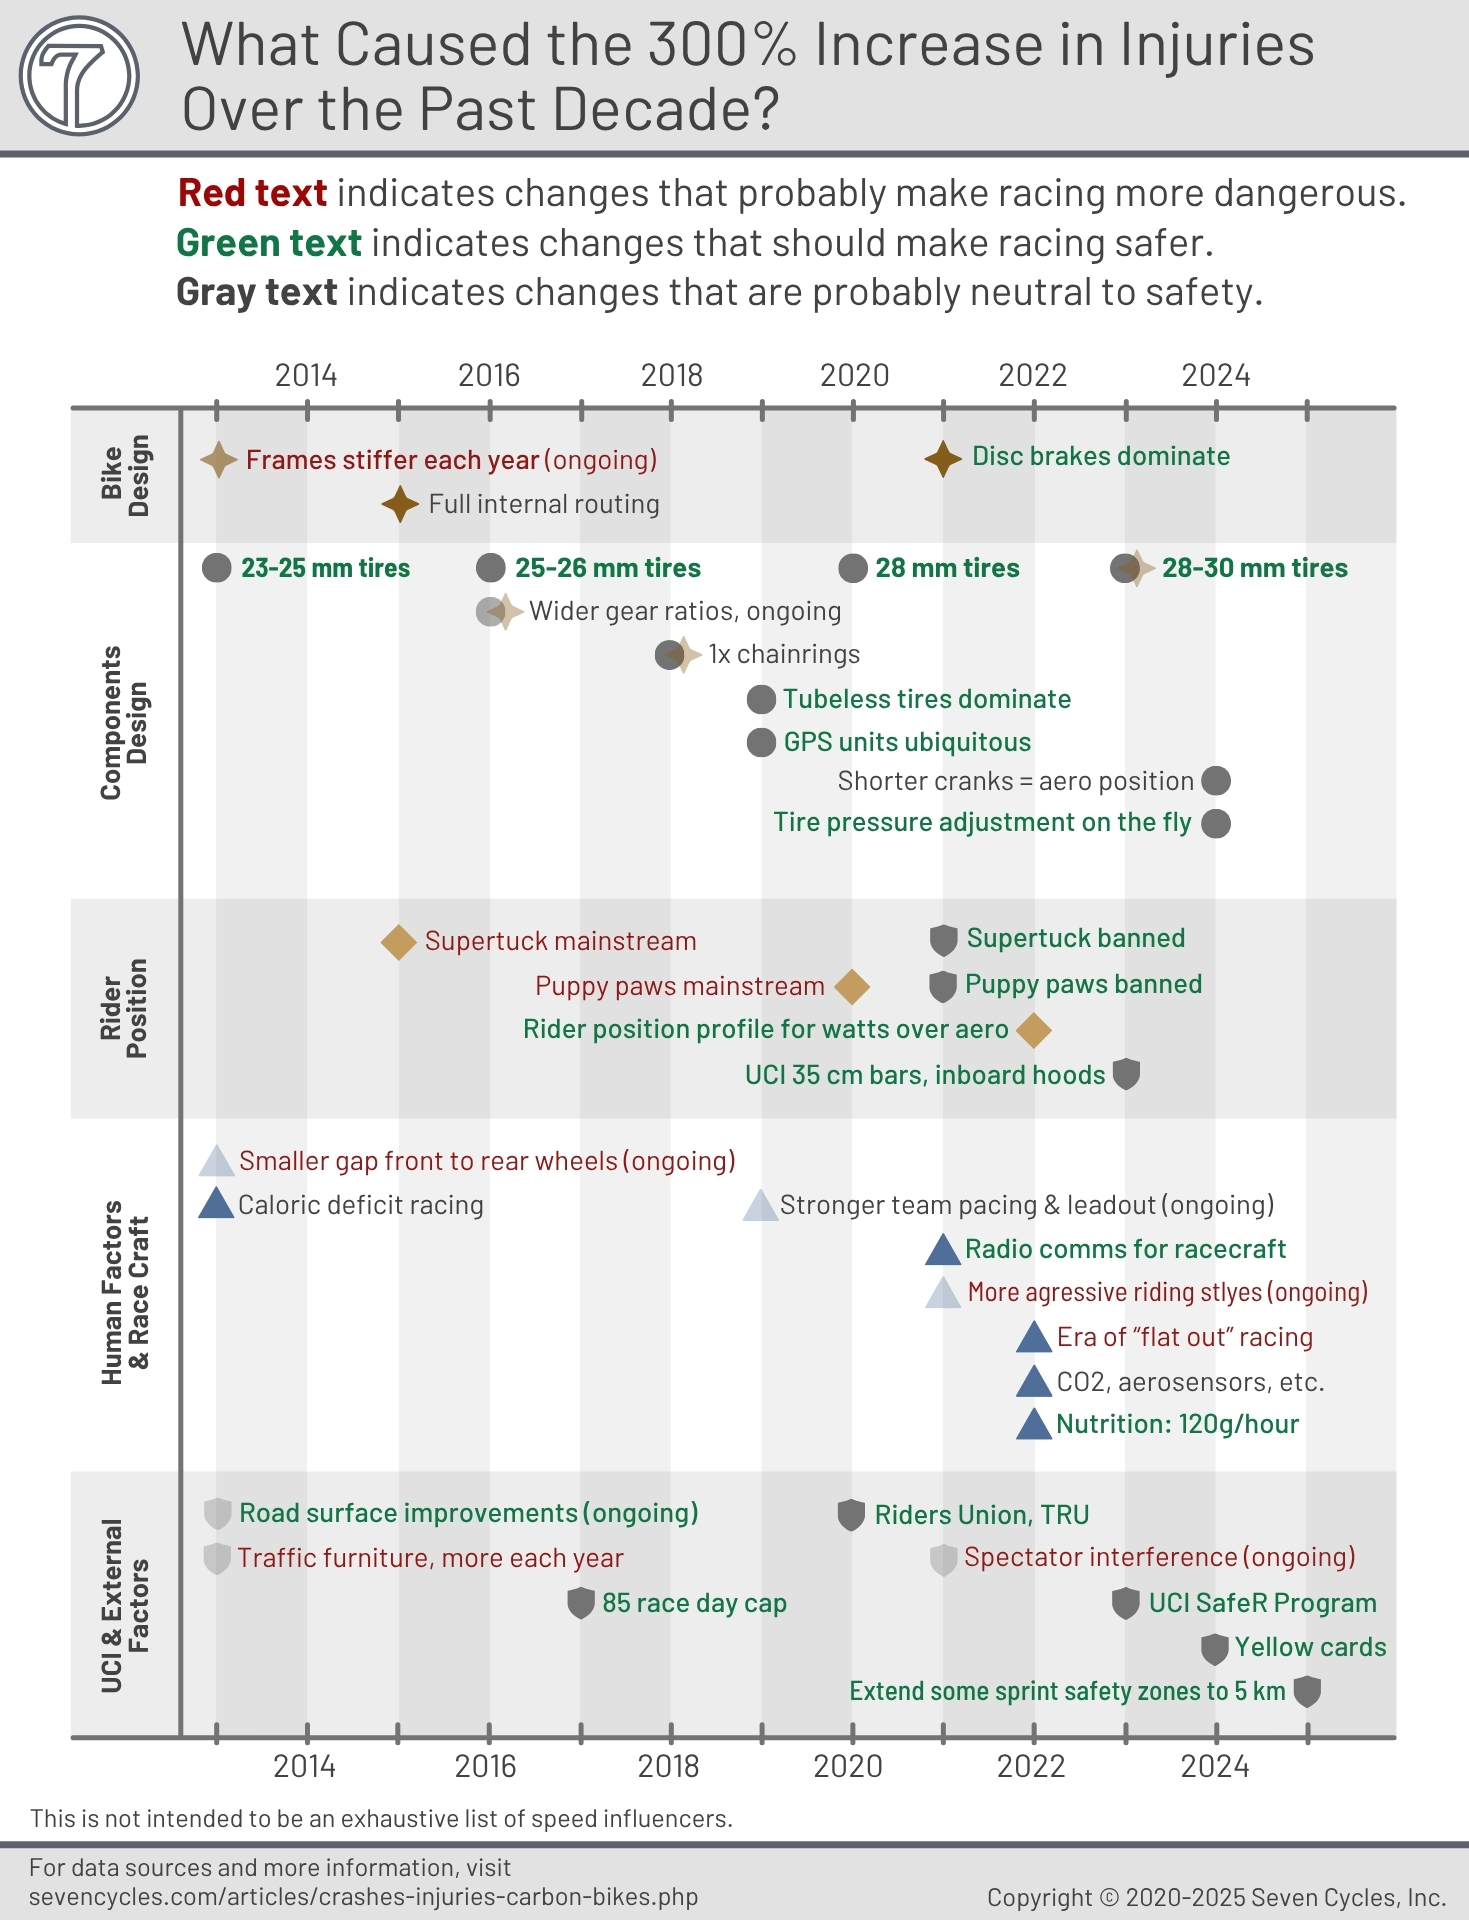
This seems at odds with the previously unheard of increase in rider injuries. Regardless, it would be difficult to argue that racing has become more dangerous over the past decade. Figure 4 shows 19 changes that should make racing safer. There are only a few changes that one could argue make racing more dangerous.
What is the cause of this three fold-injury increase?
If all of the typical tropes for so many more crashes in recent years are not accurate, what explains the incredible pace of injuries? Figure 4 shows some causes of more dangerous riding but they seem overwhelmed by safety improvements.
The data from SafeR does not appear helpful in finding answers. Fully two-thirds of incidents (not necessarily crashes, but rather dangerous situations) SafeR could not even categorize in any useful way. For example, 35% of incidents are categorized "unprovoked rider errors" and 27% of incidents had no categorization at all.[13]
Whatever the cause of so many more crashes, it's not obvious in the data. We see two significant issues: tracking of modern bikes and traction issues at the tire contact patches.
Bike Tracking Problems
By tracking, we mean the wheels keeping connected to the pavement.
A change in bike behavior is clear from watching hundreds of UCI races over the past few decades. And then watching those crashes over and over again in slow motion. We know this is not scientific, and we are loath to bring it into the conversation. Regardless, it's difficult to watch modern crashes and not think there's a bike problem.
A bike with good tracking should allow the wheels to stay in contact over bumps, vertically, and at an angle during aggressive turning. Good tracking is maximized through a combination of vertical flow (compliance) and a small amount of torsional flex in the front end. This combination enables the wheels to move in three dimensions while remaining connected to the ground. As bikes get stiffer every year, their tracking capabilities diminish. As tracking gets worse, bike control and handling become more difficult. The result is an increase in crashes.
Tire Contact Patch Conundrum
In video replay, it is far too common to see the cause of crashes to be a loss of traction. However, there are at least two reasons that traction should be significantly better than a decade ago: 1) road conditions are better than ever, and 2) tires have gone from 23 mm to 30 mm in width. (2013 marked the transition from 23 to 25 mm tires in the pro peloton.[14]) This is a 30% increase in contact patch size. No amount of frame stiffness should be able to negate the significant tire contact patch traction improvement, but here we are.
The Great Eight
This is a term Seven made up for studying race craft and modern bike design's influence on the Pro Peloton's performance. The Great Eight are the five monuments and the three Grand Tours:
- Liege-Bastogne-Liege (M)
- Paris-Roubaix (M)
- Tour of Flanders (M)
- Milan-San Remo (M)
- Il Lombardia (M)
- Giro d'Italia (GT)
- Tour de France (GT)
- La Vuelta a Espana (GT)
We use these races in part because a lot of data exists for these races over the past 50+ years. Also, because these eight are the most prestigious events of the road season, they are likely to be the fastest and most dangerous.
We use these eight to represent the entire race season. Why not use other data? There's little to no data over the past 20 years for women's road racing. There's little third-party data for cyclocross racing or mountain biking.
Footnote 11
Primoz Roglic: Example of Tracking Injuries, Not Crashes
Primoz Roglic retired from the 2025 Giro due to injuries sustained in four crashes. However, zero injuries were reported. TNT Sports reported that Roglic, "tumbl[ed] to the deck on the gravel on Stage 9, suffering two other incidents, and then going down at slow speed in the rain."
Footnotes 3 - 10
Winners & Weather Conditions 2025 vs. 2024
It's reasonable to expect who's racing and weather conditions to impact race speeds. Here are comparisons for the first four Monuments.
Liege-Bastogne-Liege
Weather: 2024 conditions were worse and should have made for a slower and more dangerous race than 2025.
2024:
- Injuries reported: 0
- Average speed: 40.9 km/h
- Podium: Tadej Pogacar, Roman Bardet, Mathieu van der Poel
- Weather: "There is a 10% chance of rain. Early in the race there was rain falling on the peloton. At the start there was light snow falling in Bastogne."
2025:
- Injuries reported: 0
- Average speed: 42.0 km/h (1.1 km/h faster than 2024)
- Podium: Tadej Pogacar, Giulio Ciccone, Ben Healy
- Weather: "There is just a 1% chance of rain."
Paris-Roubaix
Weather: Essentially identical weather conditions.
2024:
- Injuries reported: 0
- Average speed: 47.8 km/h
- Podium: Mathieu van der Poel, Jasper Philipsen, Mads Pedersen
- Weather: "There is a 2% chance of rain. Overnight there had been mild rain on the Course."
2025:
- Injuries reported: 5
- Average speed: 46.9 km/h (0.9 km/h slower than 2024)
- Podium: Mathieu van der Poel, Tadej Pogacar, Mads Pedersen
- Weather: "There is a 1% chance of rain. The was some light rain on the start city of Compiègne early in the morning [...] It had rained overnight and the skies were cloudy, yet it was not a cold nor remarkably wet race for the riders."
Tour of Flanders
Weather: 2024 conditions were worse and should have made for a slower and more dangerous race than 2025.
2024:
- Injuries reported: 4
- Average speed: 44.5 km/h
- Podium: Mathieu van der Poel, Luca Mozzato, Mils Politt
- Weather: "There is a 75% chance of rain at 3:00 PM, rising to 98% at 4:00." Photos show rain.
2025:
- Injuries reported: 6
- Average speed: 45.0 km/h (0.5 km/h faster than 2024)
- Podium: Tadej Pogacar, Mads Pedersen, Mathieu van der Poel
- Weather: "No rain is forecast."
Milan-San Remo
Weather: 2025 conditions were worse and should have made for a slower and more dangerous race than 2024.
2024:
- Injuries reported: 0
- Average speed: 46.1 km/h
- Podium: Mathieu van der Poel, Jasper Philipsen, Mads Pedersen
- Weather: "There is just a 2% chance of rain."
2025:
- Injuries reported: 1
- Average speed: 45.3 km/h (0.8 km/h slower than 2024)
- Podium: Mathieu van der Poel, Filippo Ganna, Tadej Pogacar
- Weather: "There is a 10% chance of rain. It had been raining all morning and the riders raced in the rain as they rode through Lombardy."
Footnotes
- ^ UCI SafeR update: More questions than answers? — Escape Collective. 20 January 2025
- ^ UCI SafeR update: More questions than answers? — Escape Collective. 20 January 2025
- ^ Reinventing the Wheel: The 25mm Revolution — Inrng. The Inner Ring. 2 April 2013