
Pro Peloton Fatalities Are Increasing at an Alarming Rate
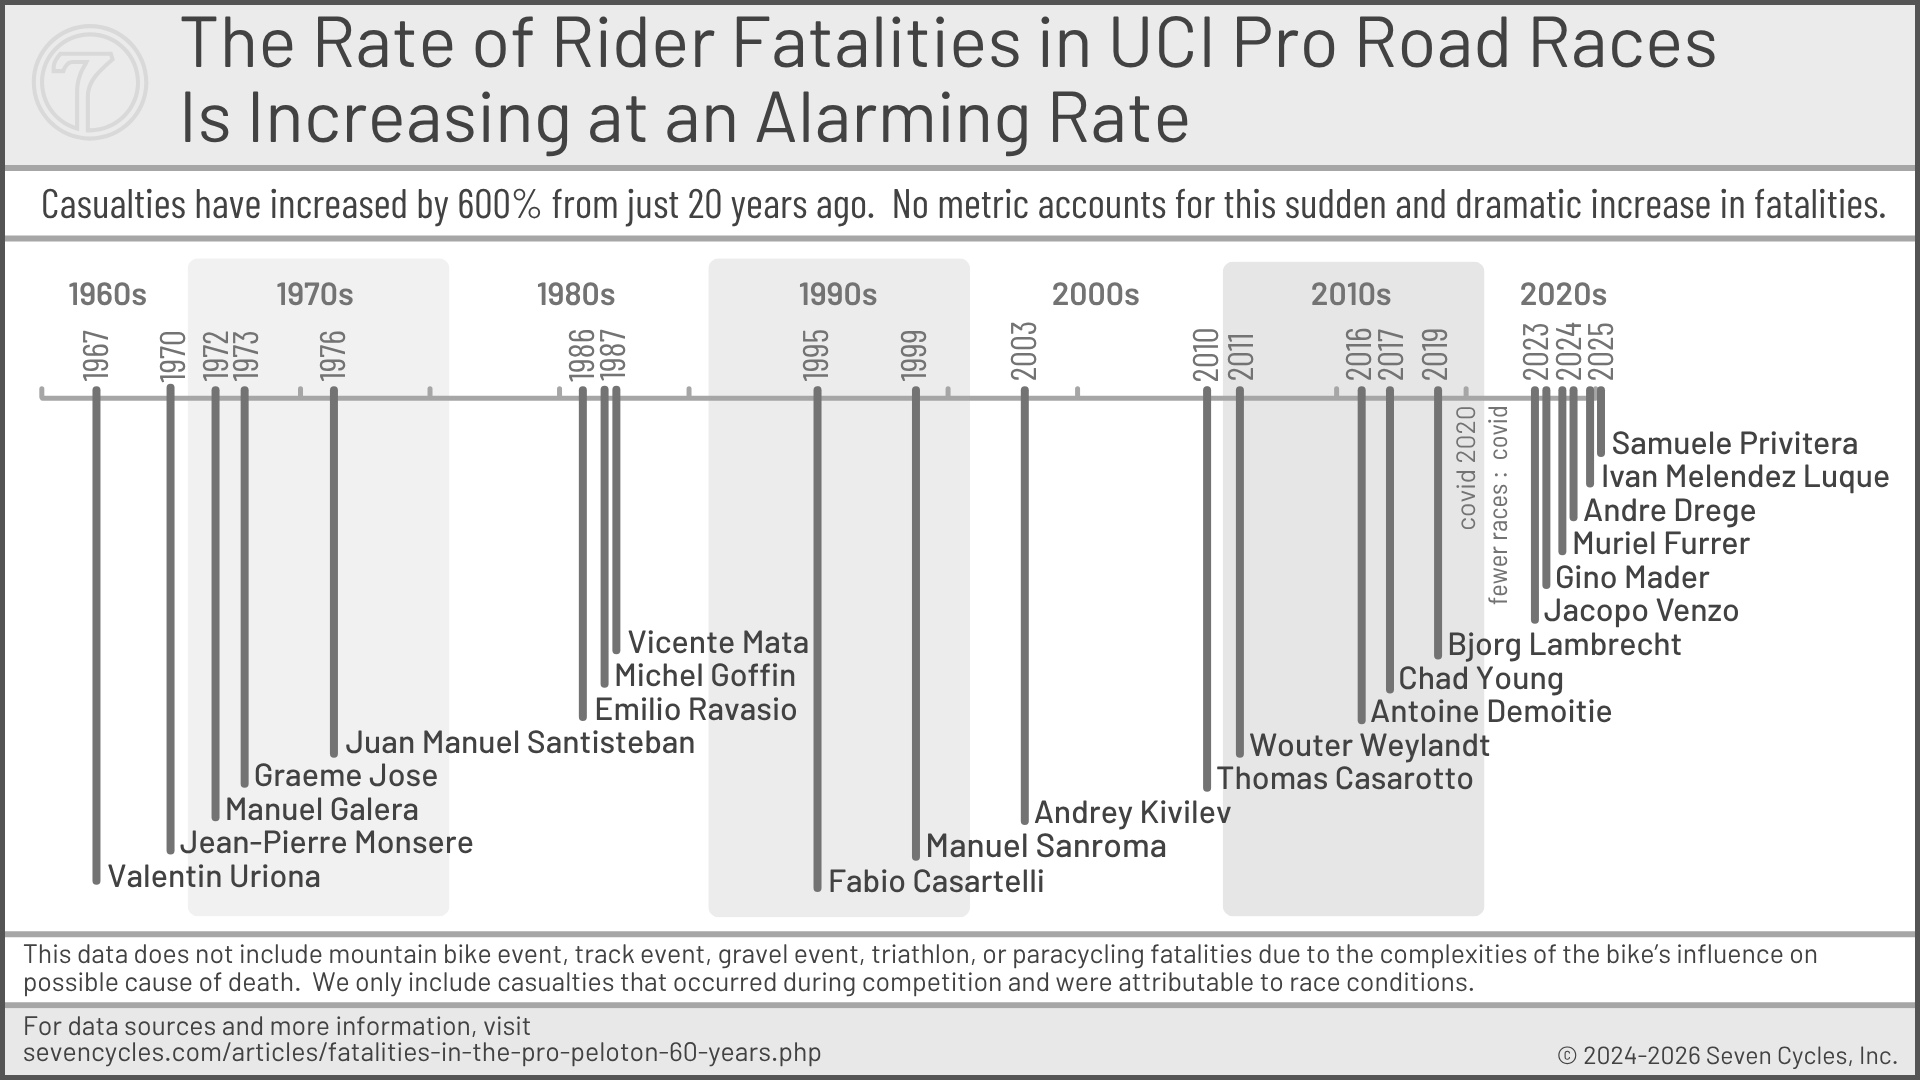
Casualties from crashes in road races at the professional UCI level have increased from about two competitors per decade to nine athletes in the past 10 years. Six of these fatalities occurred in the three seasons of 2023 to 2025.
Compared To What?
More casualties seem logical because the number of competitors has grown. Additionally, most people believe that overall speeds have soared, the number of races has increased, and races are getting longer. As a percentage of riders, maybe this increase in fatalities is a smaller share than in the past.
Unfortunately, no matter how one parses the data, the ratio of fatalities per kilometer raced has increased substantially over the past four decades and accelerated in the past few years.
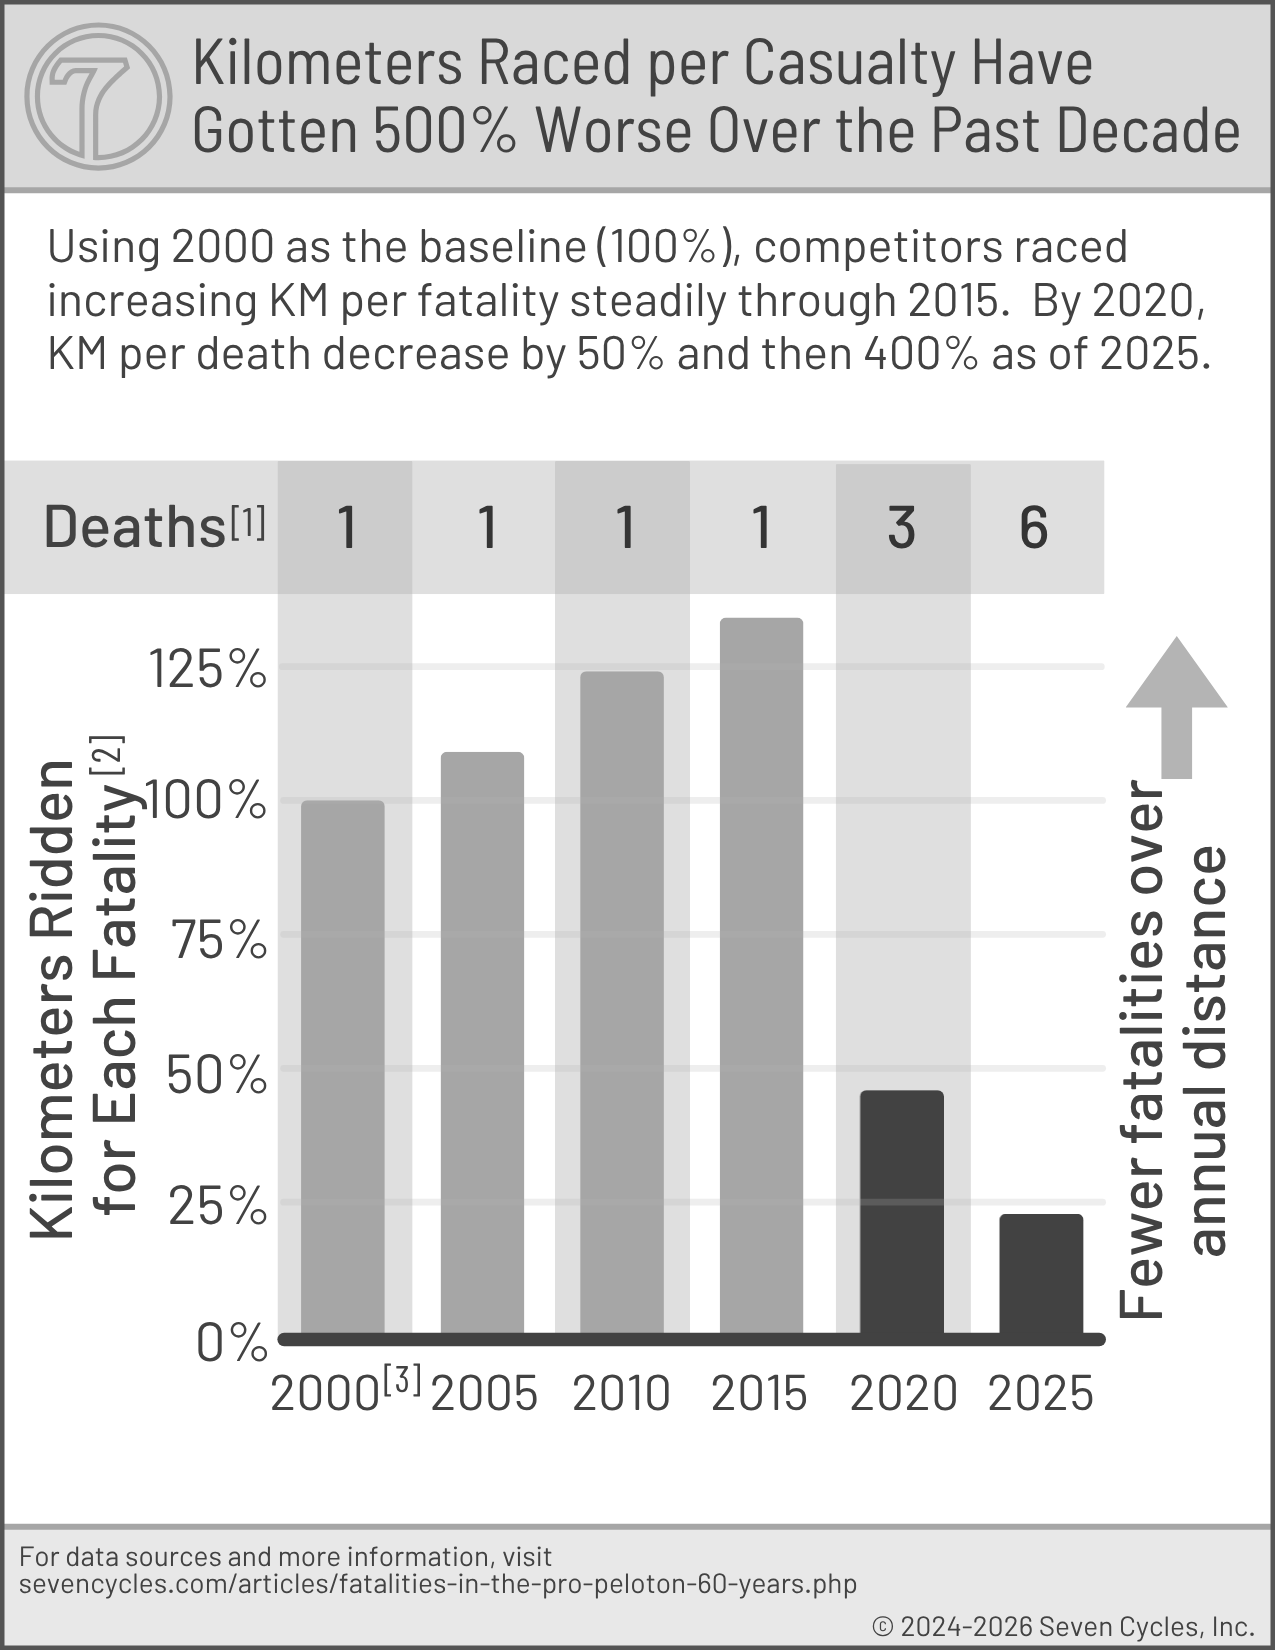
Key Metric: Kilometers Raced Per Fatality
Calculating the number of kilometers raced for each casualty is the most accurate measure of how effectively the sport protects rider safety. Figure 2 illustrates the catastrophic increase in fatalities versus kilometers raced. This metric accounts for the number of UCI road racers in the Pro Tour or higher, the number of races, and the total distance the races. See Figure 2 footnotes for more information about how Seven developed this metric.
Why should rider fatalities be researched? We pulled together data on fatalities not out of a sense of the macabre, but rather as part of our ongoing efforts to understand what's going wrong with bike control in the pro peloton. However, we couldn't find a single, clear accounting of cycling casualties caused by race conditions in the professional road peloton. So we assembled this data here.
Seven's hypothesis is that the rapidly increasing number of injuries (and by extension, fatalities) is caused by year-on-year degrading bike control and performance. For data about this decline, read Seven's article about injury statistics.
Daniel Lloyd of GCN recently posted an important video exposé: Why Are There So Many Deaths In Road Racing? His comments are insightful, and his interview with the UCI's President David Lappartient is telling. It's worth watching. It's a topic that needs attention and solutions.
Fatalities Should Be Decreasing, Not Increasing
Most UCI changes and restrictions have made cycling safer. A few particularly relevant changes are:
- 2020: Disc brakes dominate the pro peloton. Stronger braking should mean improved bike control. Disc brakes can indeed be more dangerous, but not in the hands of the best riders in the world. And, as tire contact increases, so do the advantages of stronger brakes.
- 2018: Team size has been reduced from 9 to 8 for grand tours and from 9 to 7 for major one-day races. For example, the Tour de France went from 198 riders to 176 riders on average. Fewer competitors mean less adversity.
- 2016: Tires have gotten wider and wider, from about 23 mm to 30 mm today. Wider tires with lower air pressure significantly increase tire contact patch size and traction. This should make a meaningful improvement to bike control.
- 2003: Helmets became mandatory. This has reduced fatalities from head injury by at least 20% and more likely about 40%. The data is too sparse to draw precise conclusions.
- Ongoing: Road quality gets better each year. Also, pavement grip technologies have improved immensely over the past two decades. These upgrades should enhance bike control.
What Has Changed?
Faster racing has occurred over the past few decades. Not really. As Figure 3 illustrates, the average speed of pro-level races, WorldTour 1-day races, and stage races have been increasing by about 0.3% per year. Figure 4 shows that Tour de France speeds have increased by about 8% over the past 20 years. These speed trends are nothing, but the 0.4% annual speed increase does not reconcile with the accelerated number of injuries and fatalities over the past decade.
More races than 30 years ago. Not true. UCI racers compete in significantly fewer events annually. Figure 3 shows the dwindling number of WorldTour road races. In another example, the year 2000 saw 105 and 85 races by the first and 100th-ranked UCI racers respectively. In 2025, those numbers were 91 and 75, a 16% reduction.
Races are longer than they used to be. This is not accurate. The three Grand Tours and five Monuments have gotten 3% shorter over the past 25 years, as Figure 3 illustrates. Figure 4 shows that the Tour de France has gotten 10% shorter over the past two decades.
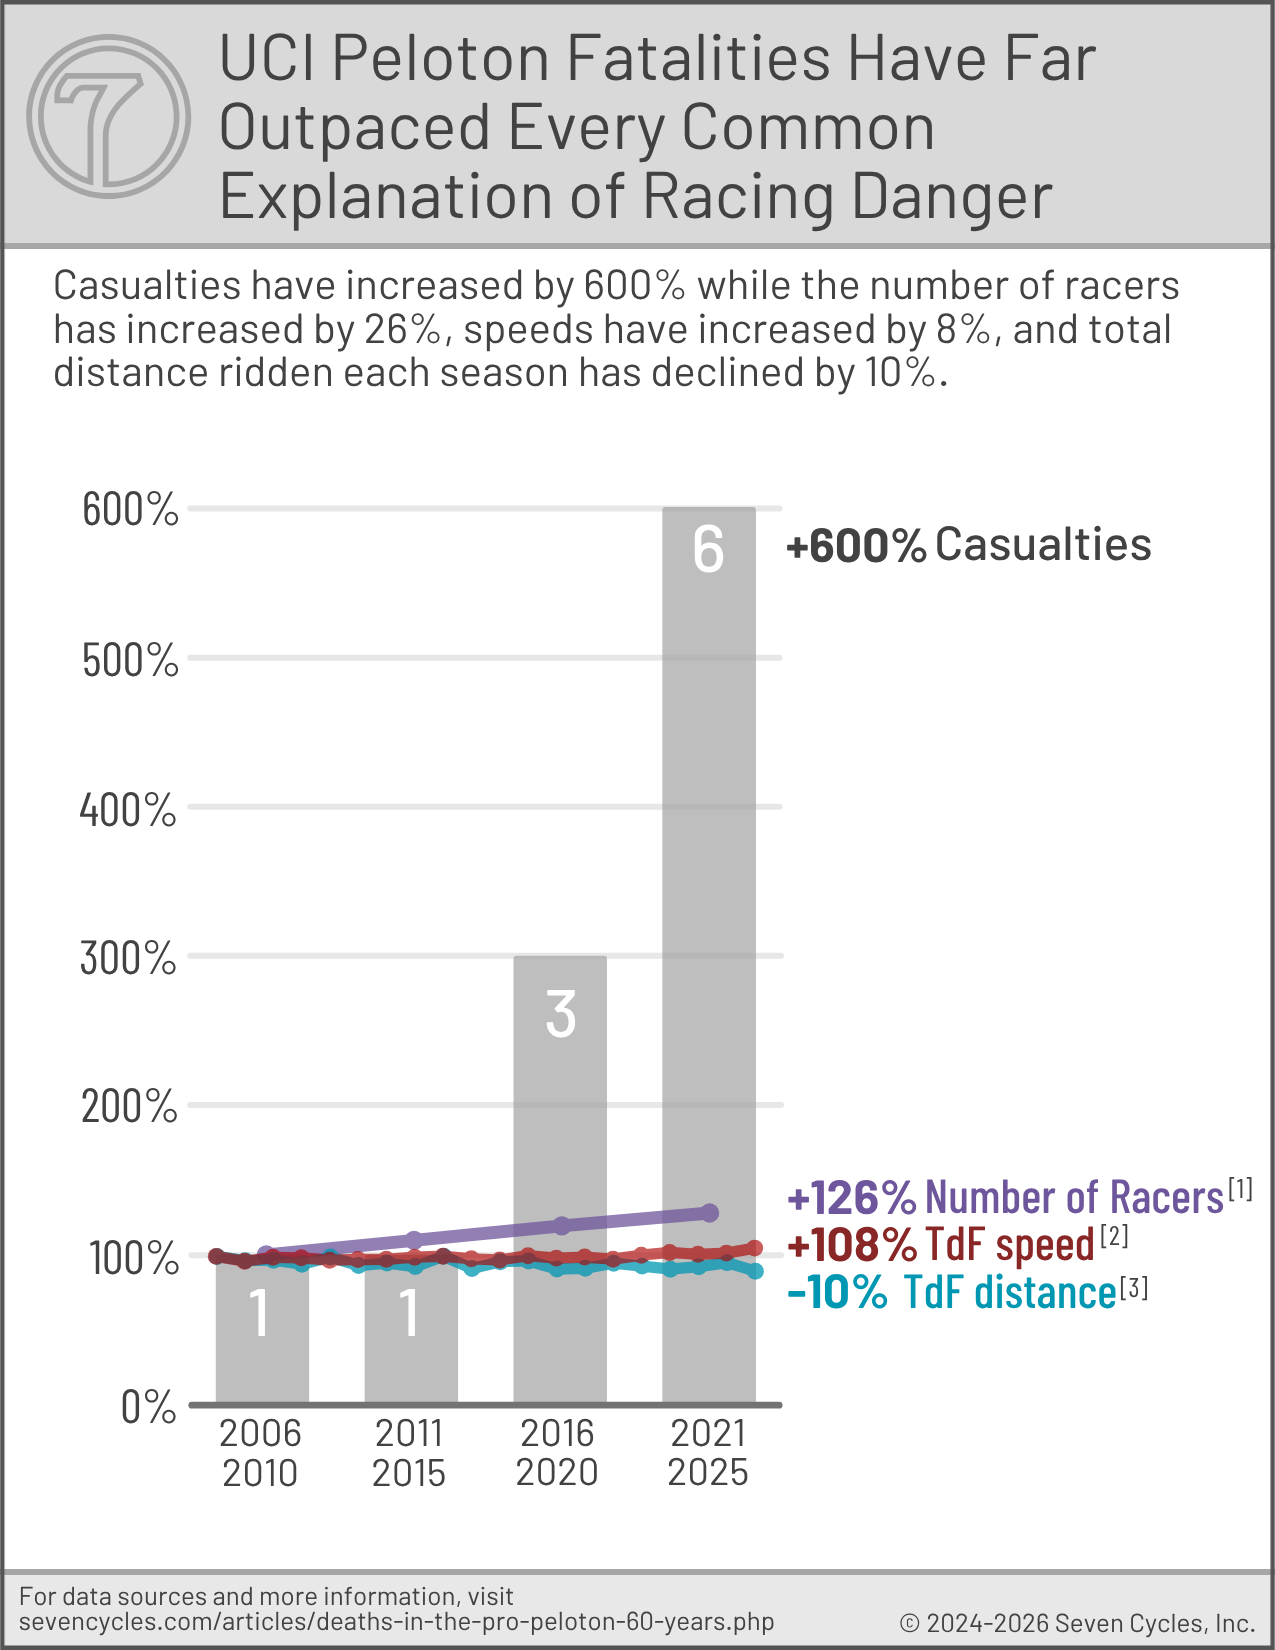
More racers are competing. Yes, but the 26% increase in UCI racers over the past 20 years does not correlate to the 600% increase in casualties, as Figure 4 illustrates. In fact, the ratio of racers to fatalities was improving for 50 years (from the 60s to 2010), all while participation increased steadily. 2010 appears to mark a transition from ever-lower-percentage of fatalities to a disturbing increase.
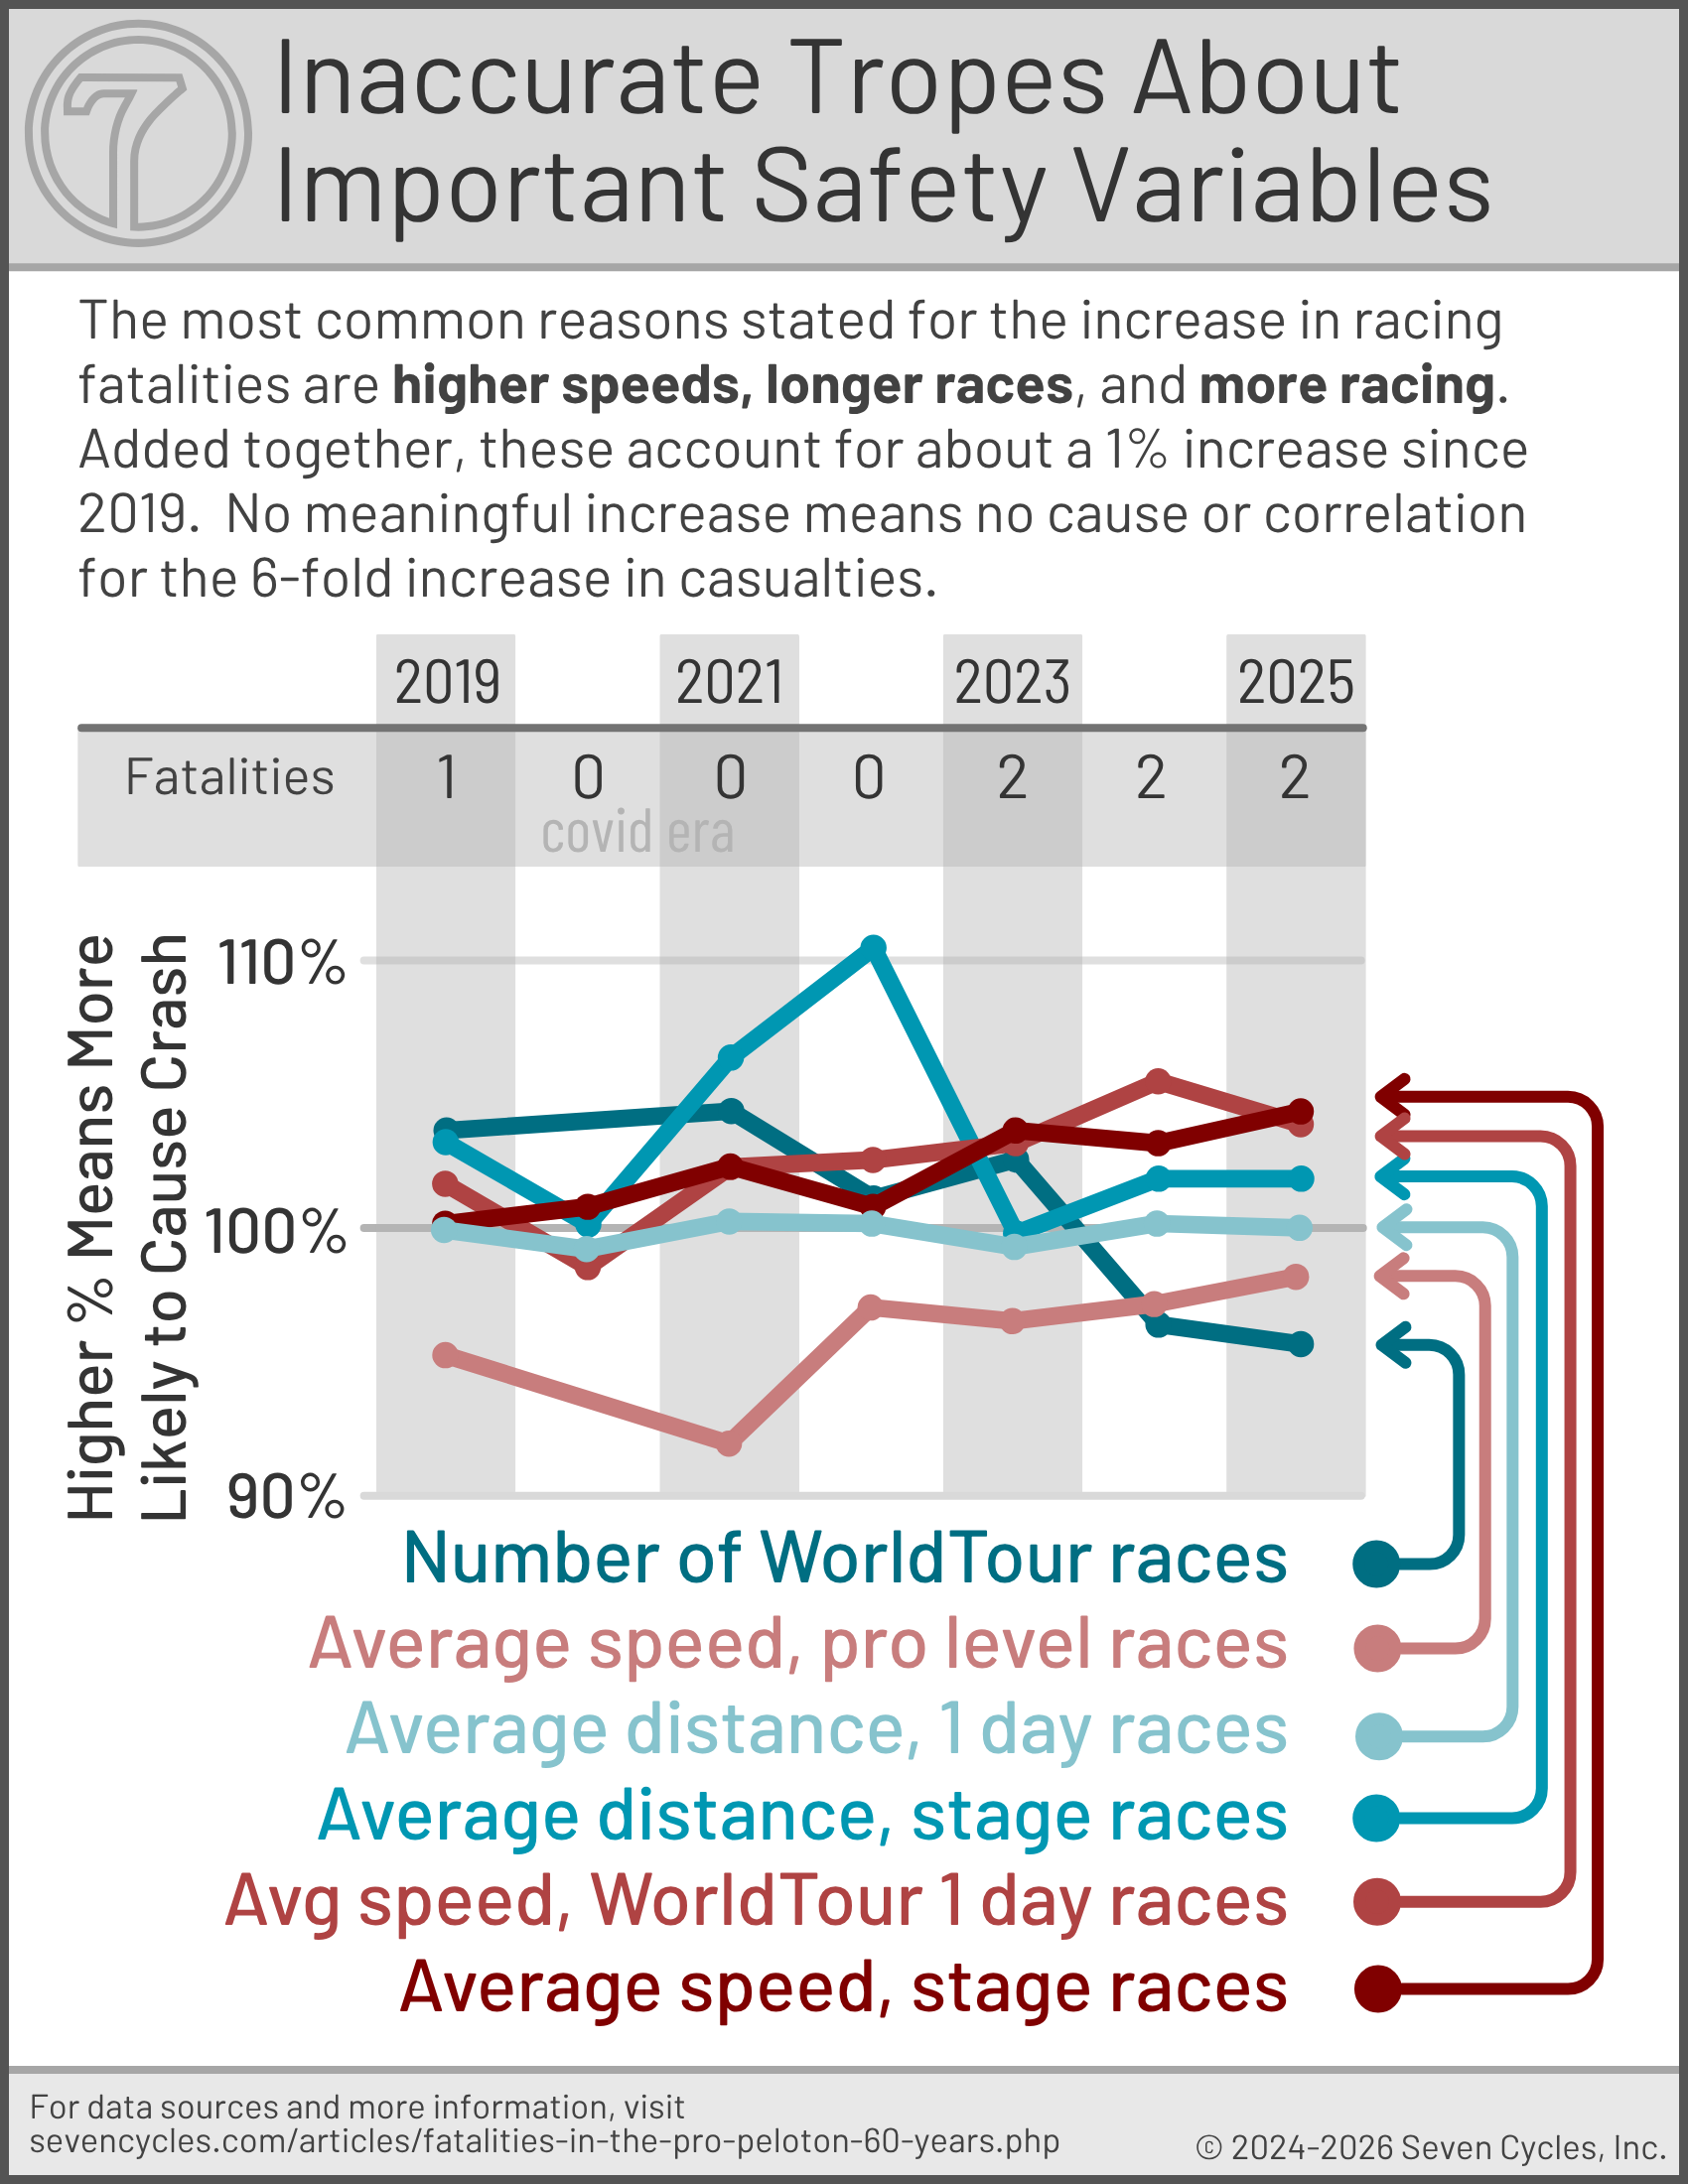
Zoom In To The Past Few Years
2023 marks a sixfold increase in fatalities over the past 20 years. Figure 4 illustrates some of the common explanations for the rise in crashes, but none of these have increased over the past decade and therefore, do not contribute to injuries in any measurable way. Since 2019 (the year of the most recent loss of life before 2023), speeds have increased by about 4%. The number of races has decreased by over 10%. The average distance has decreased by about 1%.
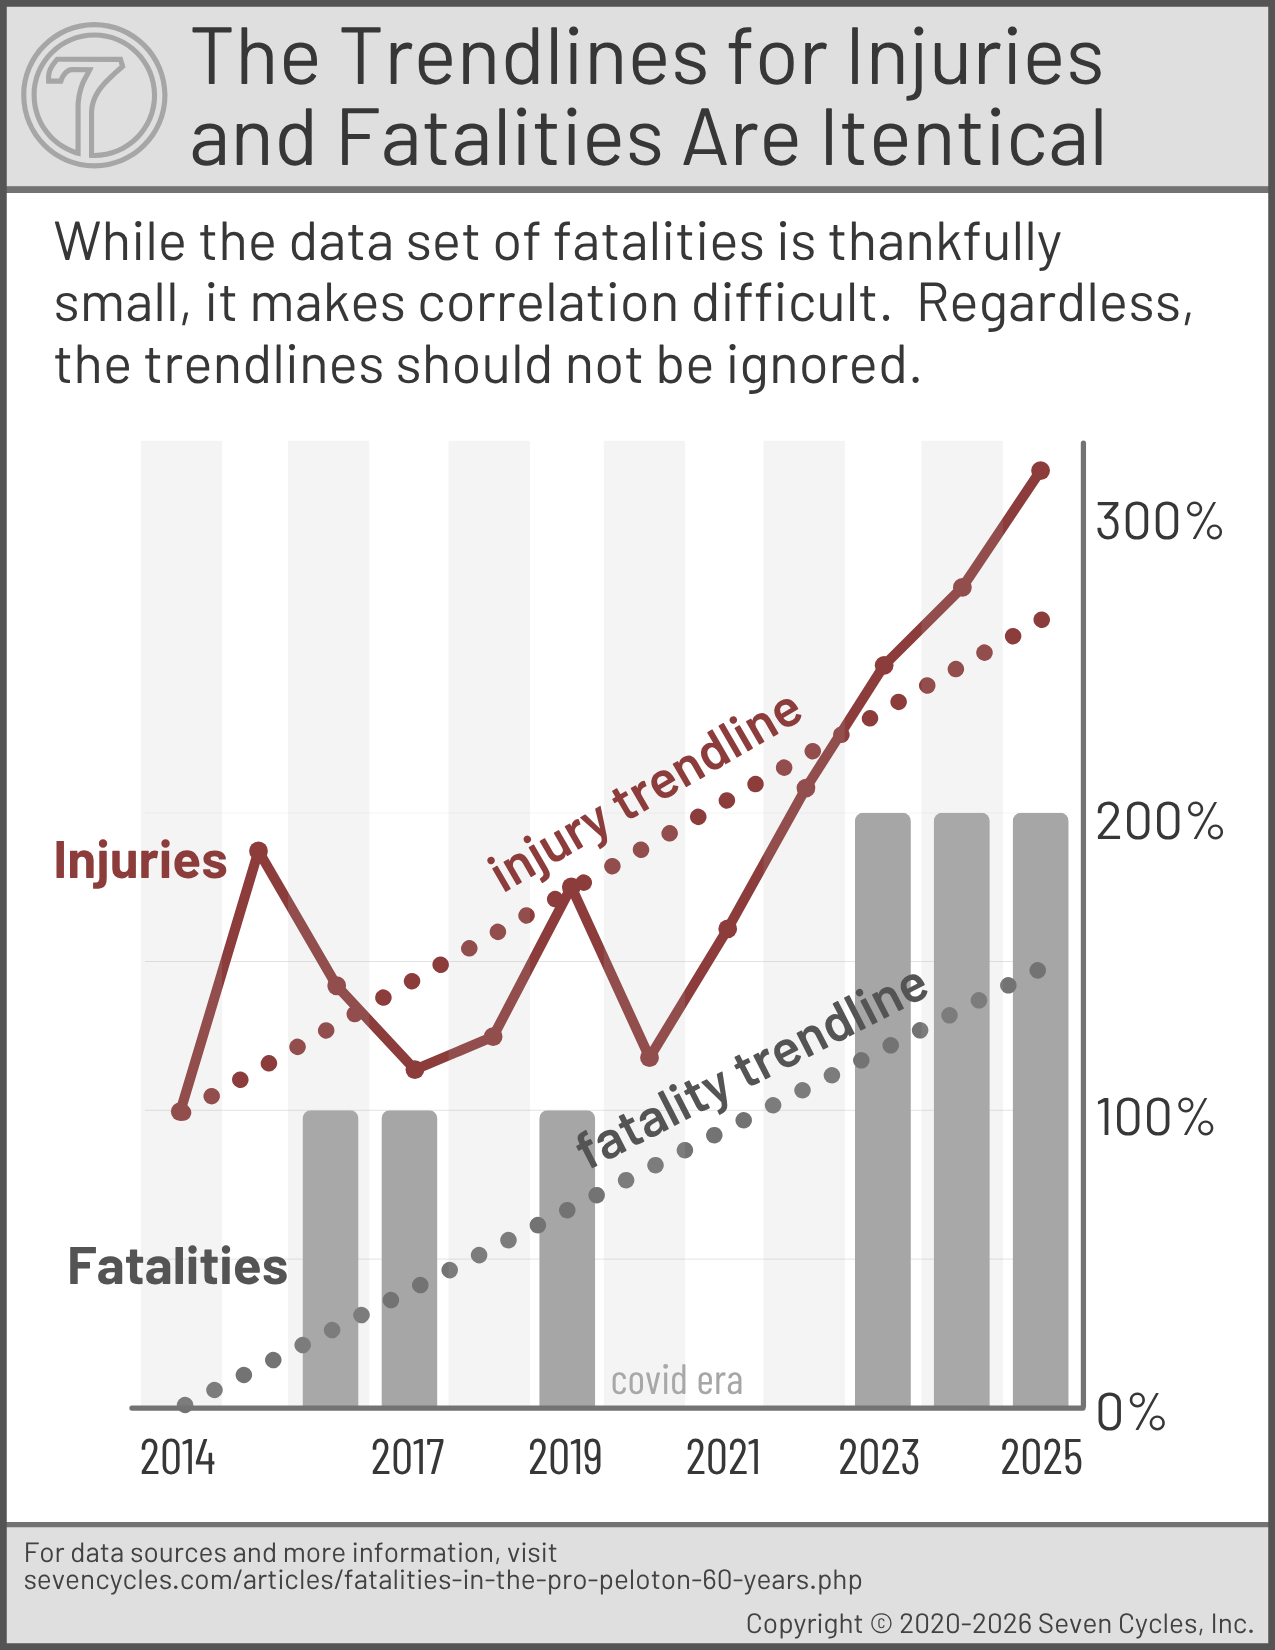
Injuries Vs. Fatalities
Over the past decade, the increase in crashes matches precisely the increase in fatalities. Figure 5 illustrates the matching trendlines of both data sets.
It's important to note that the number of casualties is so small that a single fatality can significantly alter the data. Regardless, the current trend cannot be ignored, and we don't think it's coincidental.
All UCI Pro-Level Race Fatalities Over The Past 60 Years
The purpose of tracking this specific subset of fatalities is to understand better why road racing has become so much more dangerous in the past decade.
This dataset includes only loss of life that occurred during competition and was attributable to rider behavior, bike function, or race conditions. (We did not include, for example, loss of life due to heart failure while racing.) This data also does not include mountain bike races, track events, gravel races, triathlons, or paracycling fatalities. We exclude these categories, in part, due to the complexities of these sports' influence on the possible cause of death. Not including loss of life due to other circumstances does not imply that those deaths are not equally heartbreaking.
| Year of Fatality | Rider | Cause Of Death |
|---|---|---|
| 2025 | Samuele Privitera | Head injury from speed bump crash on a descent |
| 2025 | Ivan Melendez Luque | Group crash possibly caused by a tire blowout |
| 2024 | Andre Drege | High-speed descent, hit debris, rear tire blowout |
| 2024 | Muriel Furrer | Head injury caused by a crash on descent, wet weather |
| 2023 | Gino Mader | Crashed on a "dangerous descent" and fell into a ravine |
| 2023 | Jacopo Venzo | Crashed on descent |
| 2019 | Bjorg Lambrecht | Crash caused by embedded roadside reflectors |
| 2017 | Chad Young | Head injury caused by a group crash on descent |
| 2016 | Antoine Demoitie | Group crash and was hit by a motorcycle |
| 2011 | Wouter Weylandt | Crash on descent |
| 2010 | Thomas Casarotto | Head injury from a crash into a parked car |
| 2003 | Andrei Kivilev | Head injury from a crash with his hands off bars |
| 1999 | Manuel Sanroma | Head injury from a crash during the final sprint |
| 1995 | Fabio Casartelli | Head injury from descent with group |
| 1987 | Vicente Mata | Hit by a car during a race |
| 1987 | Michel Goffin | Head injury from a crash |
| 1986 | Emilio Ravasio | Crash during a race, no details |
| 1976 | Juan Manuel Santisteban | Head injury from a crash |
| 1973 | Graeme Jose | Crashed into a parked truck during a race |
| 1972 | Manuel Galera | Crash during a race, no details |
| 1970 | Jean-Pierre Monsere | Hit by an oncoming car during a race |
| 1967 | Valentin Uriona | Crash during a race, no details |
Footnotes for Figures
Figure 2 footnotes and text:
Determining kilometers ridden: This is actually the total kilometers ridden by the 100th-ranked racer multiplied by the total number of racers with at least 50 PCS points. The logic for this simplification stems from data availability and a lack of endless time to crunch numbers. Whatever data weirdness may occur, it will hold true for each timeframe and therefore be irrelevant to the overall data trends.
Why use the 100th-ranked rider? This is a corollary for an average WorldTour rider. It's not helpful to track the top rider or the laggards.
Why use 50 PSC points as the lower threshold for counting the number or riders? We cannot find data for riders with fewer points. Why not use UCI points instead of PCS points? Tracking UCI points is agonizingly time-consuming. PCS points are statistically identical in outcome, and the data are readily available.
Footnotes:
- Fatalities over the previous five years.
- 100%: We use the percentage relative to 2000 data because the raw KM data are in the millions, so it's big numbers.
- See "Determining kilometers ridden" above.
- We only track the past 30 years because we cannot find older data for the total number of riders or the total km ridden.
- For 2020 we used 2019 data due to Covid race cancellations.
Figure 4 footnotes and text:
UCI Peloton Fatalities Have Far Outpaced Every Common Explanation of Racing Danger, Even While Many Safety Mechanisms Have Been Instated
Fatalities have increased by 600% while the number of racers has increased by 26%, speeds have increased by 8%, and total distance ridden each season has declined by 10%.
- Number of racers: Every UCI pro-level racer with 50 or more PCS points. Points indicate that the rider is active.
- Speed: In this chart, we use Tour de France (TdF) speed as a corollary for all races. This is generous because the TdF speed has increased faster than the average set of races. We use TdF speed because it is a reasonable shorthand for average speed change over time.
- Distance: In this chart, we use the G8 distance because it's a good average for all races. The G8 are the three Grand Tours and the five Monuments. (G8 is the acronym for Great Eight, a shorthand term that Seven uses for the most important road races of the season.)