
Carbon Frames Deliver on Few of Their Promises
Carbon delivers fragility, ever-declining drivetrain stiffness, spreadsheet speed only, poor handling, increasing harshness, short life span, and less.
The media proclaim endless positives about carbon bikes. What else can they do? Carbon is 99% of the high-end market. More importantly to this white paper, the press often states that bike technology and aerodynamic innovations are primary reasons bike racing is faster than ever:
"World Tour cyclists are going faster than ever [...] most of it is down to the bikes." — Global Cycling Network[hmfhb]
"The equipment used by professional riders is simply faster now than it was 18 years ago. [...] massive difference in speed a modern bike can make." — Bicycling Magazine[trafa]
"The big tech leap forward [...] aero [...] powering the latest innovation of bike tech." — VeloNews[arbttm]
In most cases, statements like these are provably untrue. On one hand, that's fine, who cares; riders should buy whatever they want. On the other hand, many millions of marketing dollars push the narrative that you can buy world champion speed or, at worst, significantly more speed than your five-year-old state-of-the-art bike currently provides. Those marketing claims are misleading or flat-out false. Riders are being deceived and paying for performance they are not receiving.
Table of Contents
- Five Shortcomings
- Carbon Performance Is Getting Worse
- Aerodynamics
- Speed
- Lightness
- Stiffness
- Pros Ride
- Harsh, Not Stiff
- Abrasion & Wear Issues
- Impact & Fragility Problems
- Longevity & Fatigue Failure
- Aerodynamic Failure
- Harsher Every Year
- Ride Feel & Sensory Feedback
- Impeded Rider Recovery
- Race Speed Despite Technology
- Lighter Weight Means Fragile, Not Faster
- Condition 1: Not Durable
- More Crashes More Often
- Why Do Suppliers Even Offer Carbon Frames?
- Choose Seven
- References
In this white paper summary, we dispel the most common misconceptions about carbon frame performance.
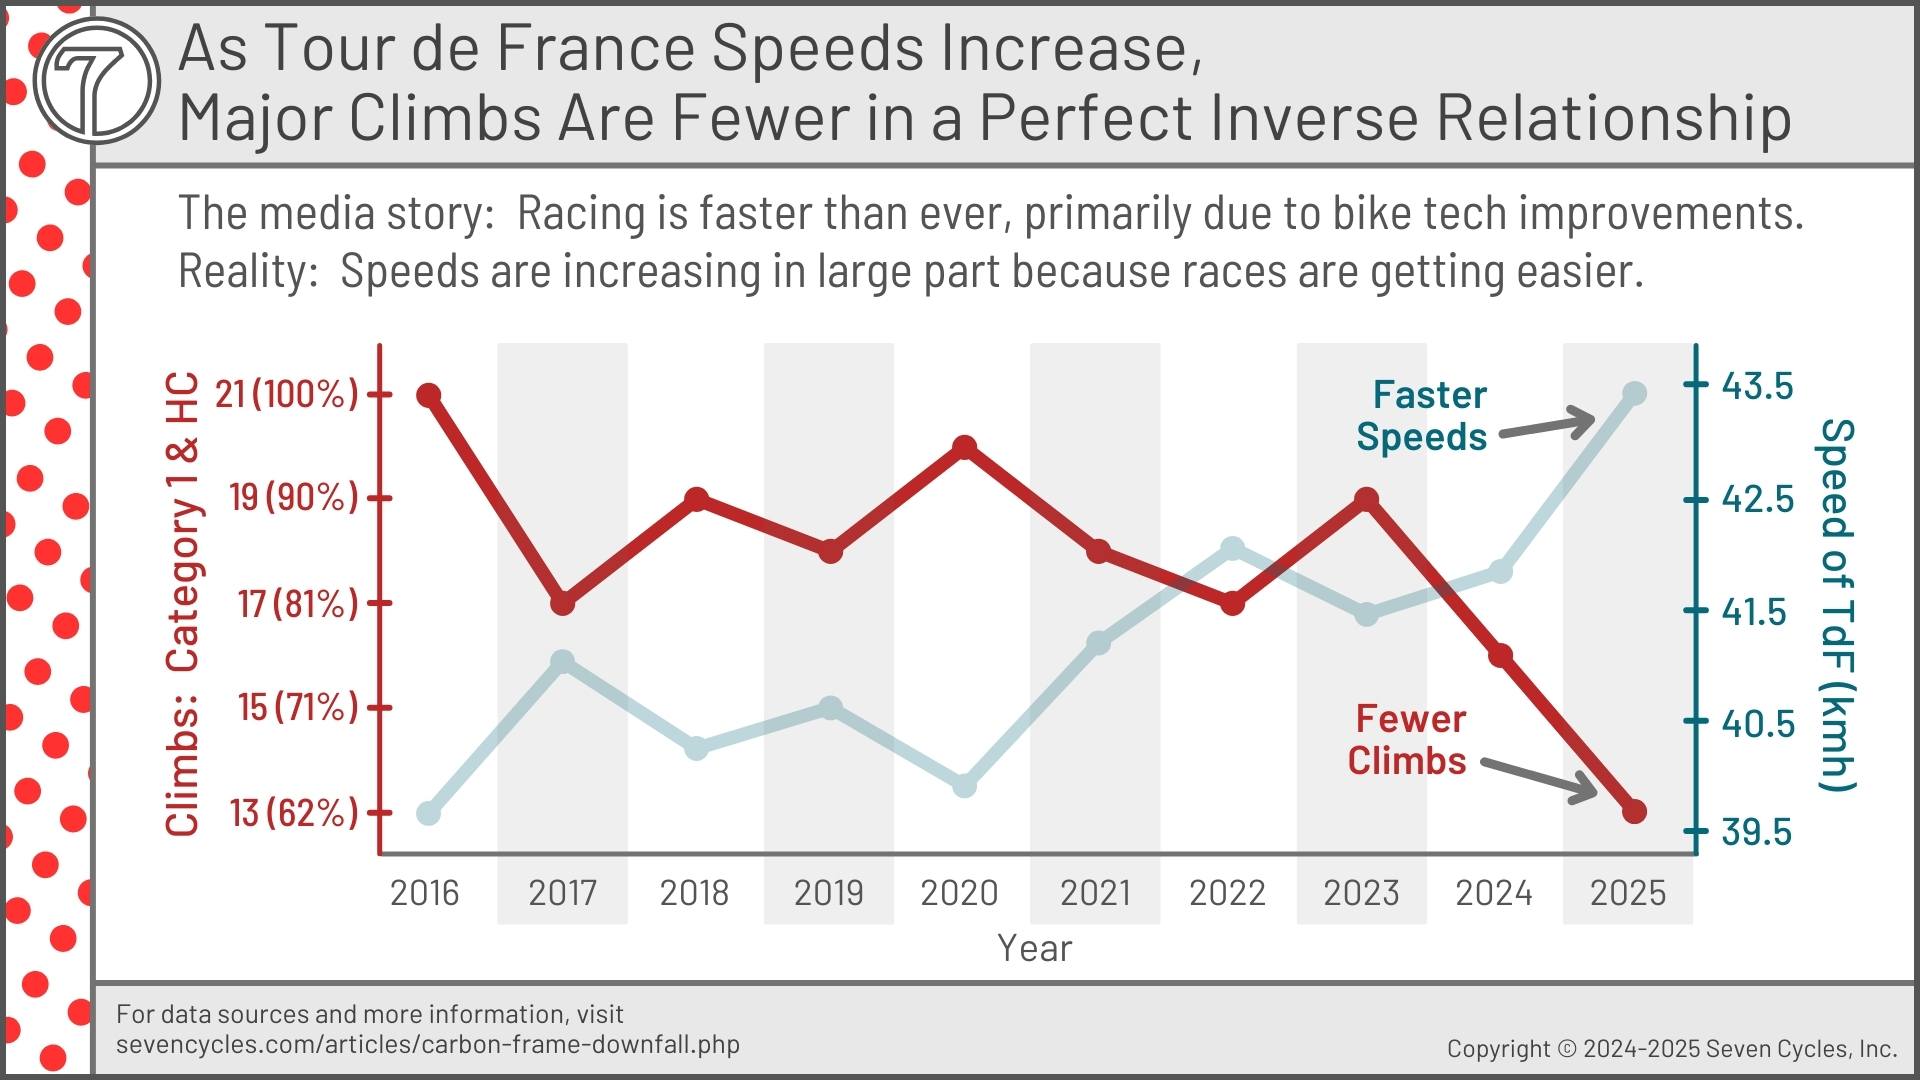
Confusion: Are Racers Faster or Are Races Easier?
The most common carbon bike misconception is that frame technology and ever-improving aerodynamics are making racing faster and faster. The One Example Of Many figure below illustrates the simplest reason that the Tour de France is faster; there are far fewer hard climbs.
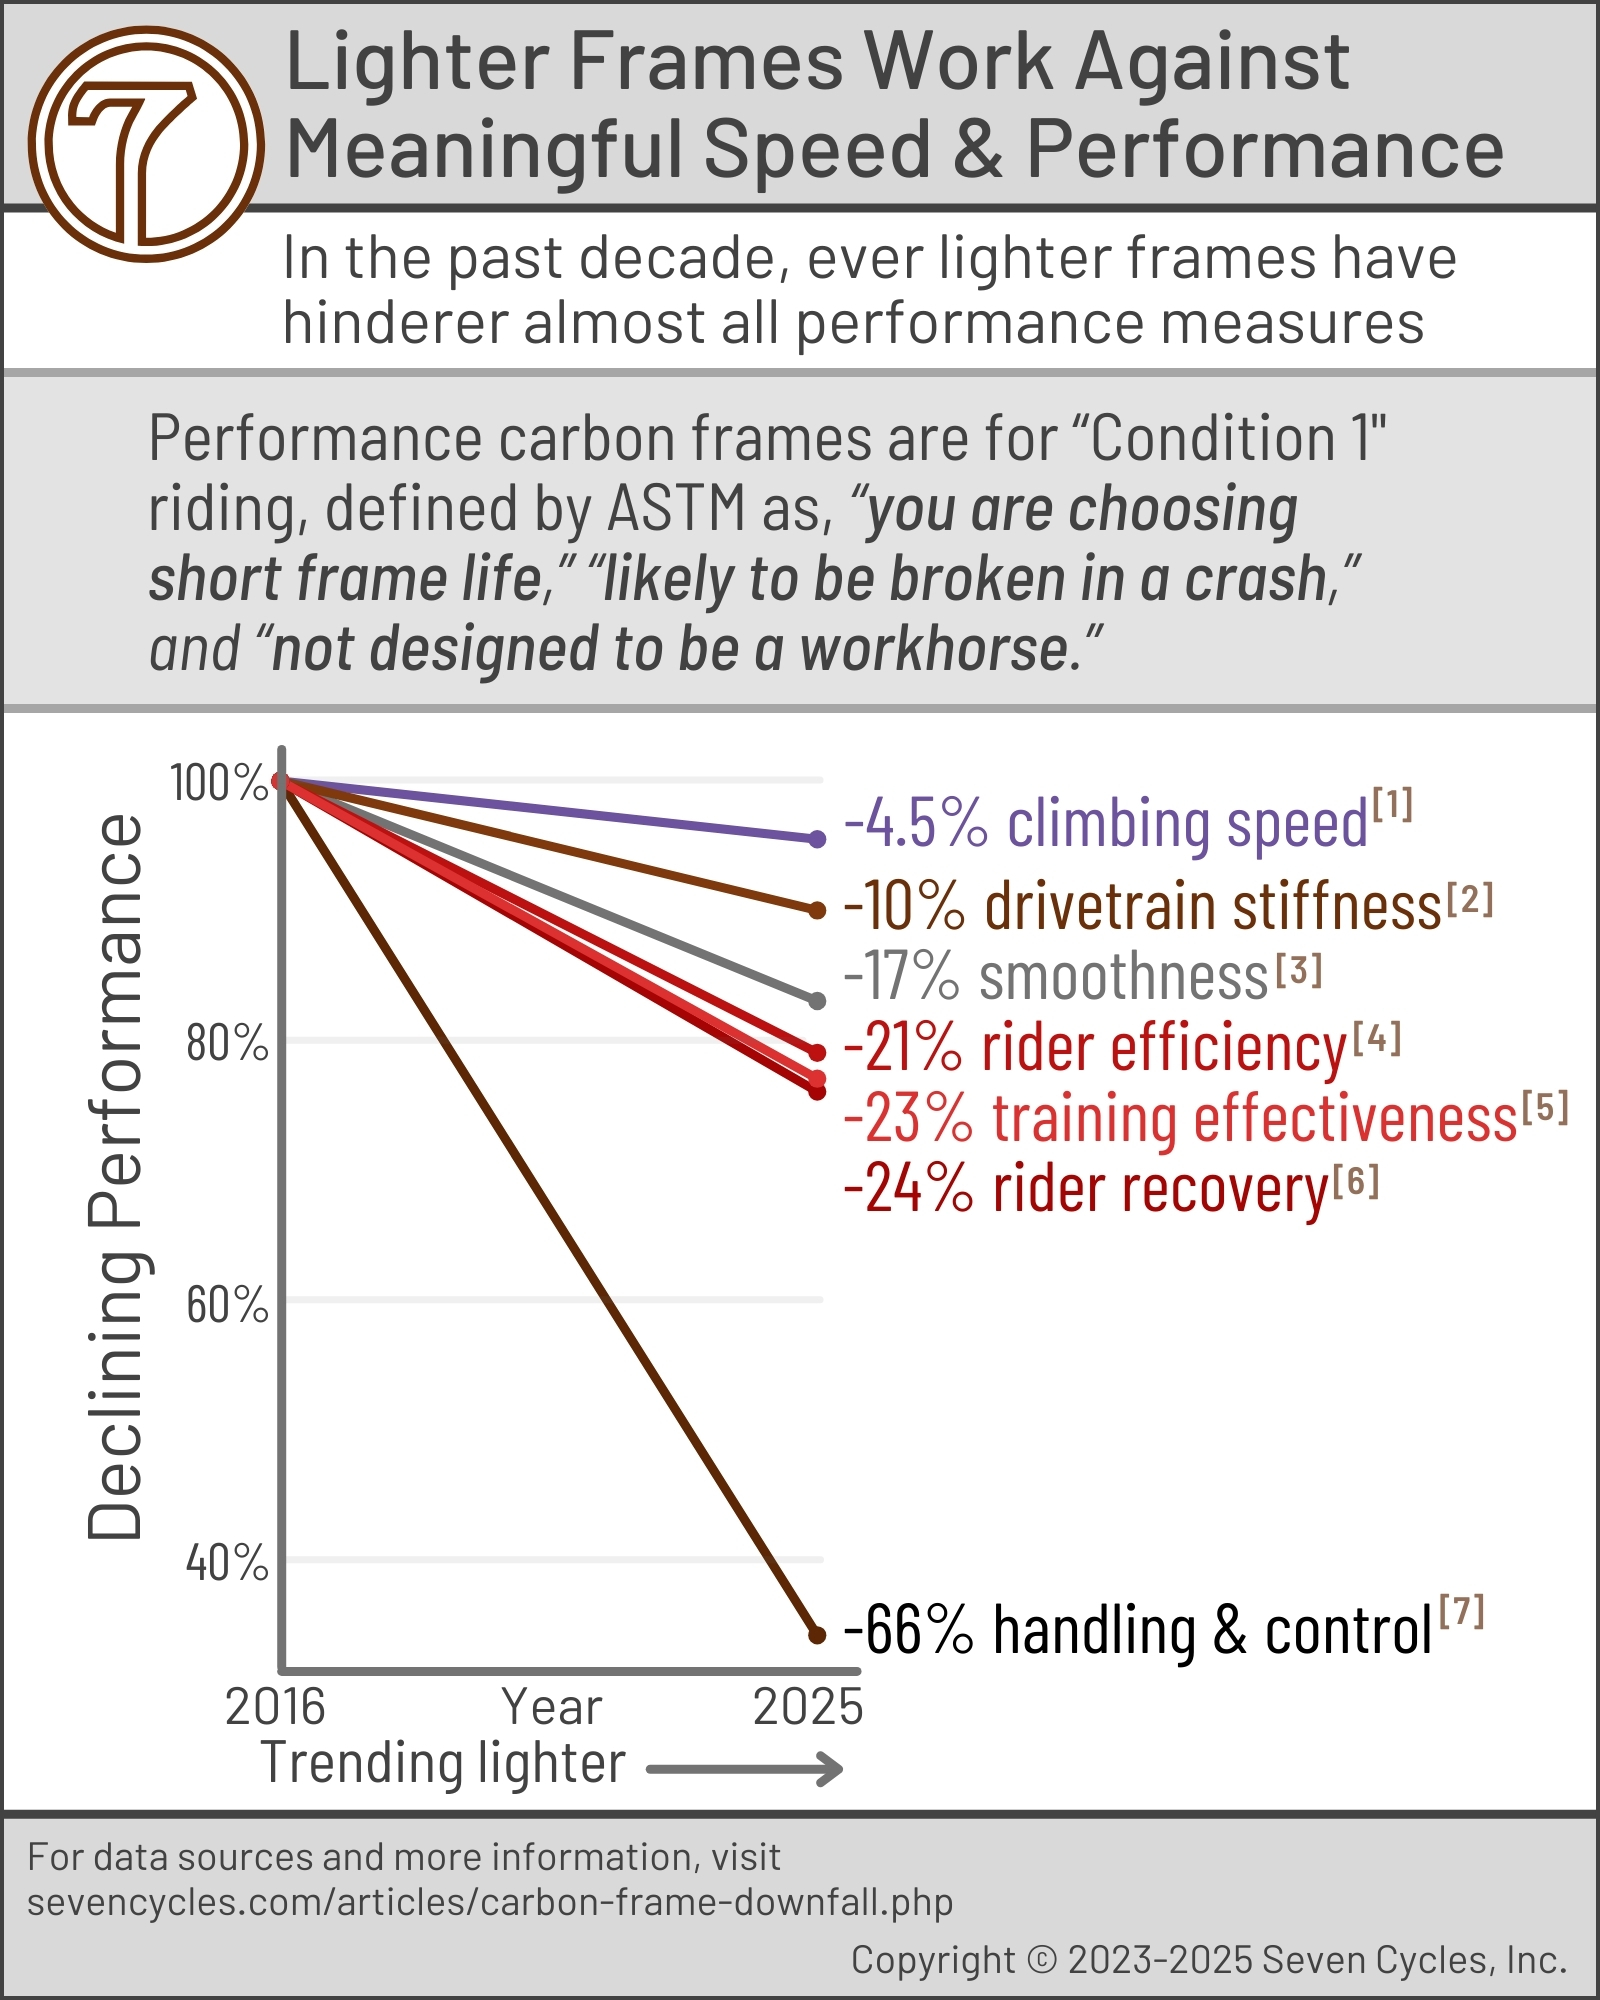
Five Big Carbon Frame Shortcomings
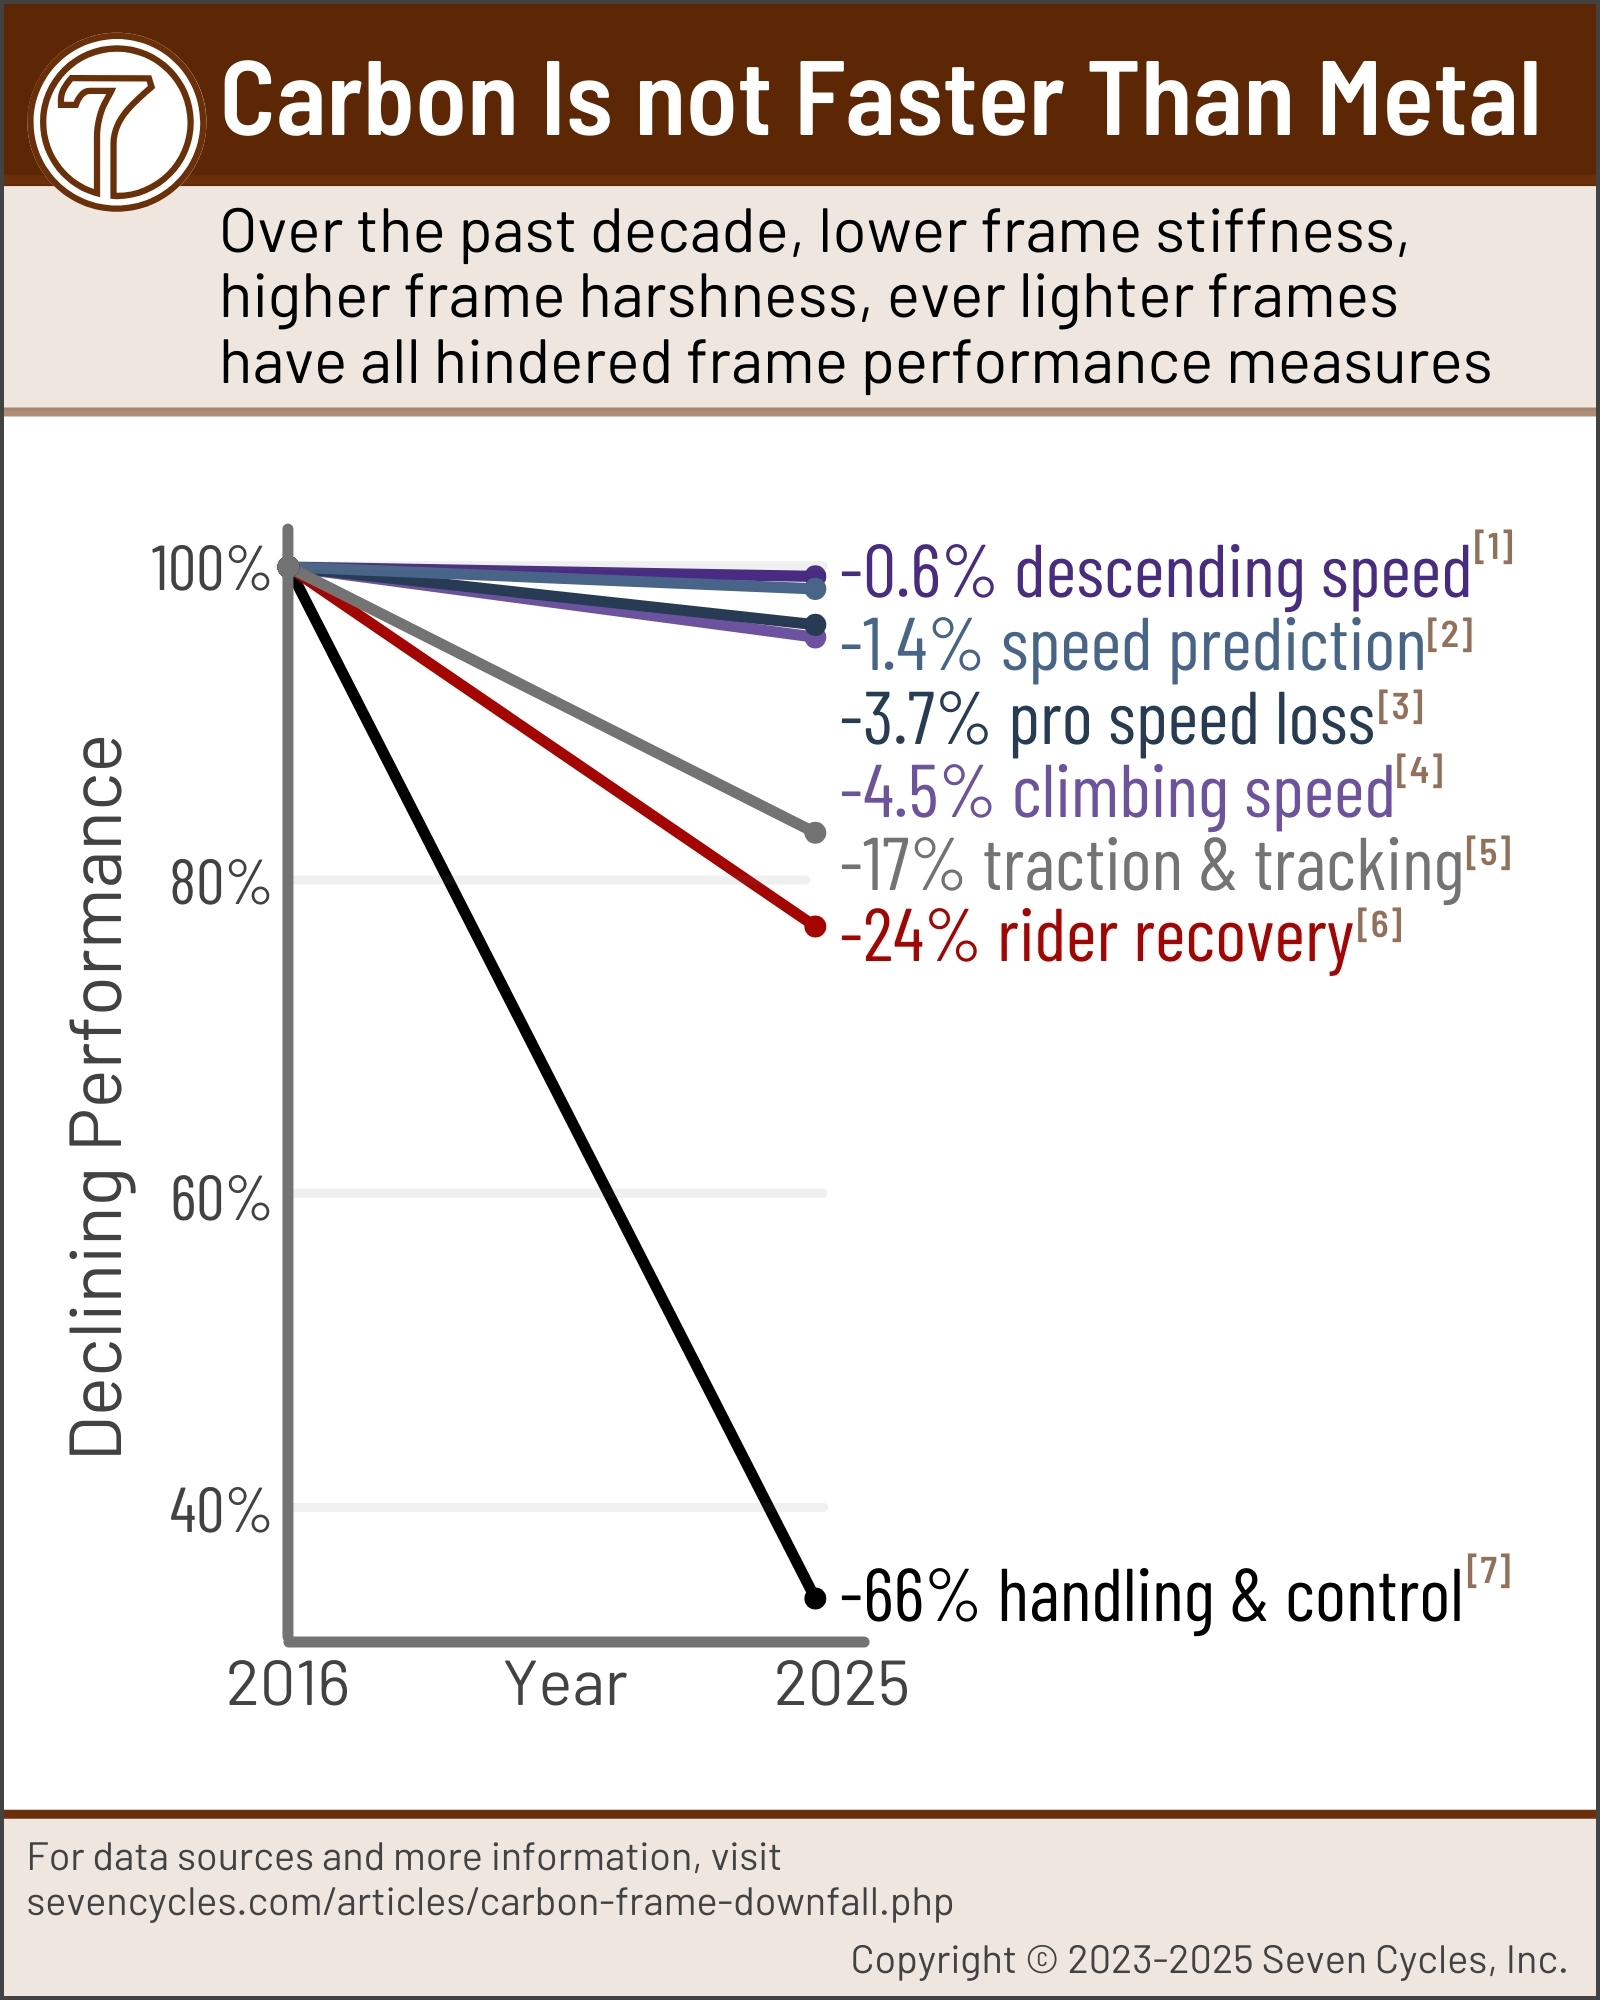
By nearly every metric, carbon performance has gotten measurably worse over the past decade.
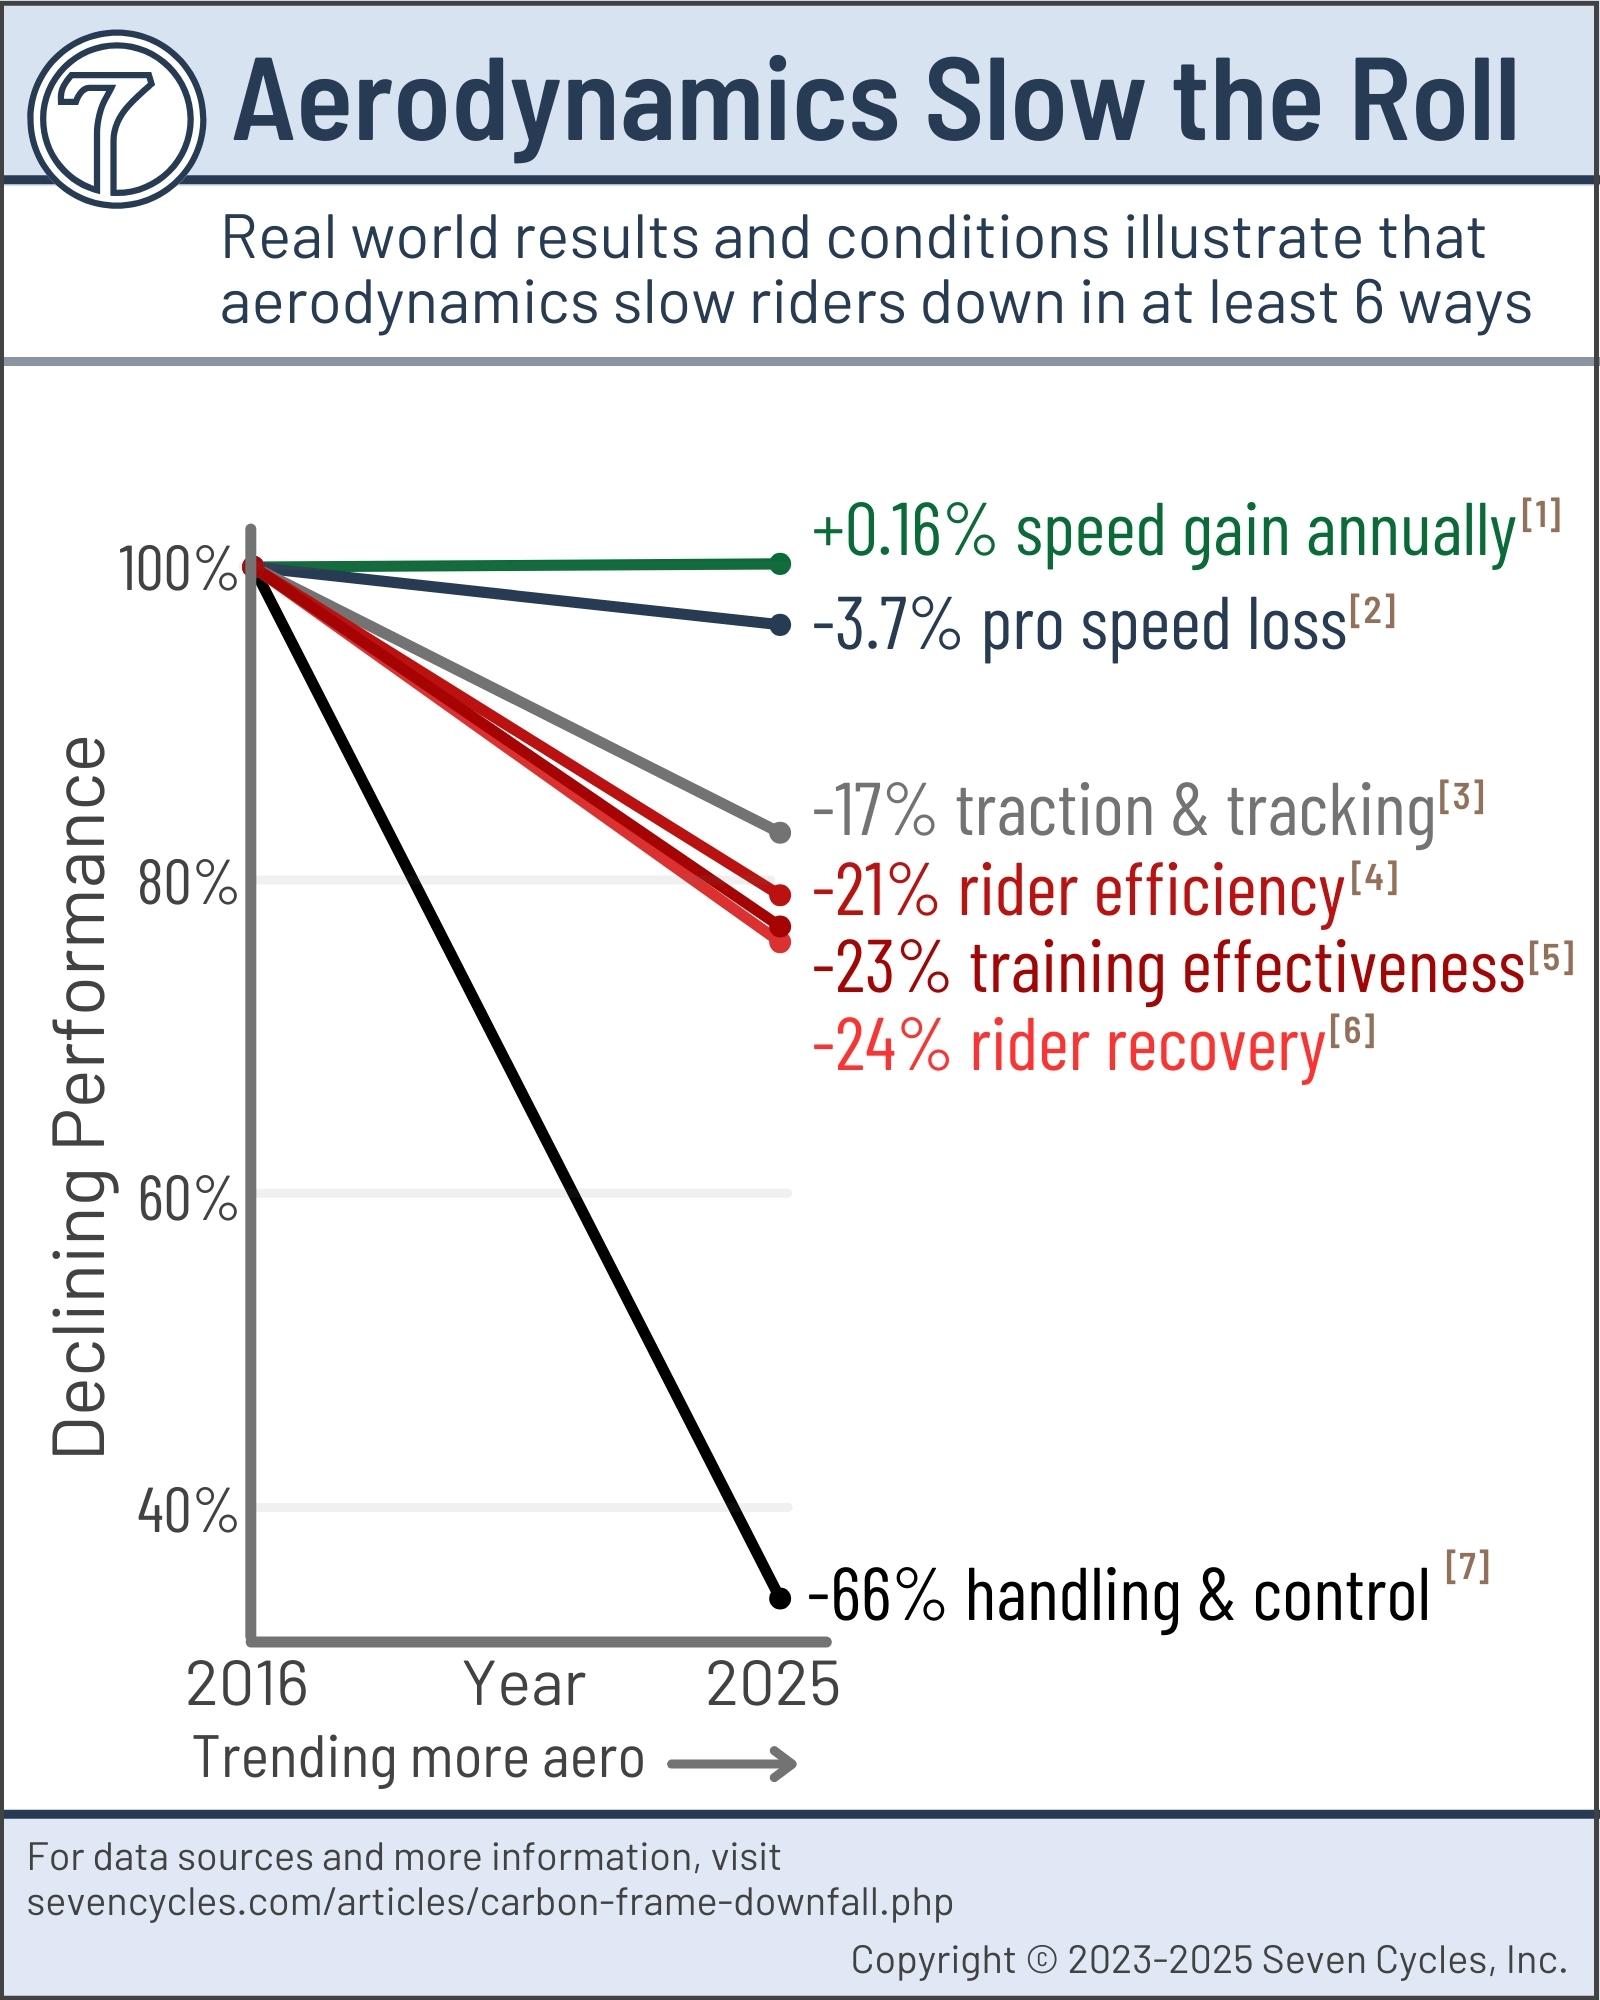
First: Aerodynamics are making bikes slower. A traditional bike on a group ride is faster in all respects except in a wind tunnel.
Second: Speed is up in pro racing despite technological evolution. Bike races are getting faster, but it's because races are easier (shorter, less climbing, better roads), not because of bike tech "improvements."
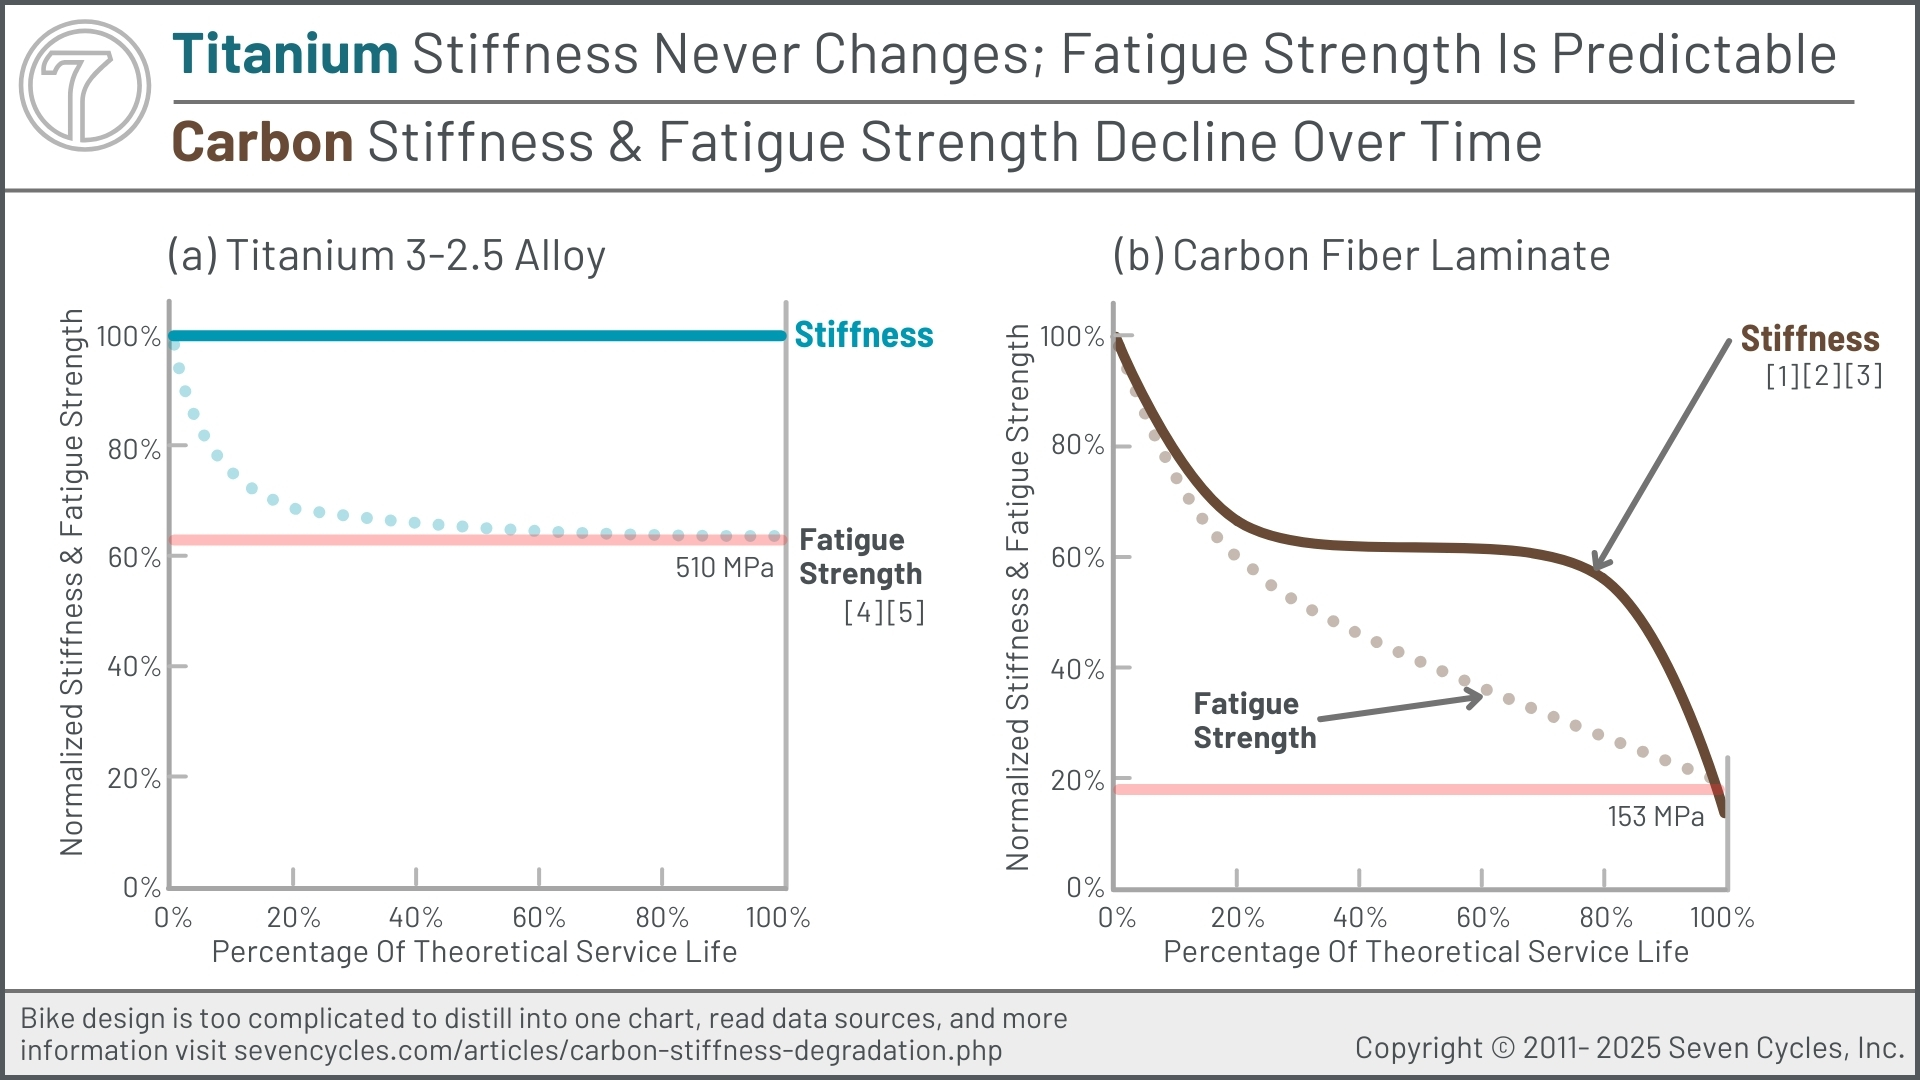
Third: Frame stiffness, by design, is down from a decade ago. Separately, carbon laminate stiffness declines with every ride.
Fourth: Lighter-weight bikes are not faster, but they do affect speed negatively.
Fifth: Damage intolerance in four ways: 1) Negligible wear resistance. 2) Disappointing impact resistance, 3) Likely fatigue failure because carbon's laminate resin has no functional fatigue strength. 4) Monocoque carbon bike frame structures can access only about 10% of carbon's raw material strength.
Bonus Problems
- Bike handling has gotten worse over the past decade, as evidenced by 300% more injuries and crashes at the World Tour road racing level, and slower relative race speeds, only explained by difficult-to-handle bikes.
- Carbon rides harsh. A harsh ride handles poorly. A harsh ride is an exhausting ride. Carbon frame harshness has increased over the past decade.
- Rider recovery time is significantly worse both on-bike and post-ride.
Challenging Popular Thought
This white paper presents ideas that run counter to prevailing industry beliefs. Therefore, all findings presented here are based on third-party data and are verifiable across multiple sources. Regardless, it is possible that within so many words we have made an error or oversight. If you find a data error, please notify us. It is not our intention to present misinformation or incorrect information.
All third-party sources are linked, referenced, or footnoted.
Cut To the Chase: Choose Seven
Read Seven's solutions to all of these issues at the bottom of this page.
Why read Seven's words on this topic?
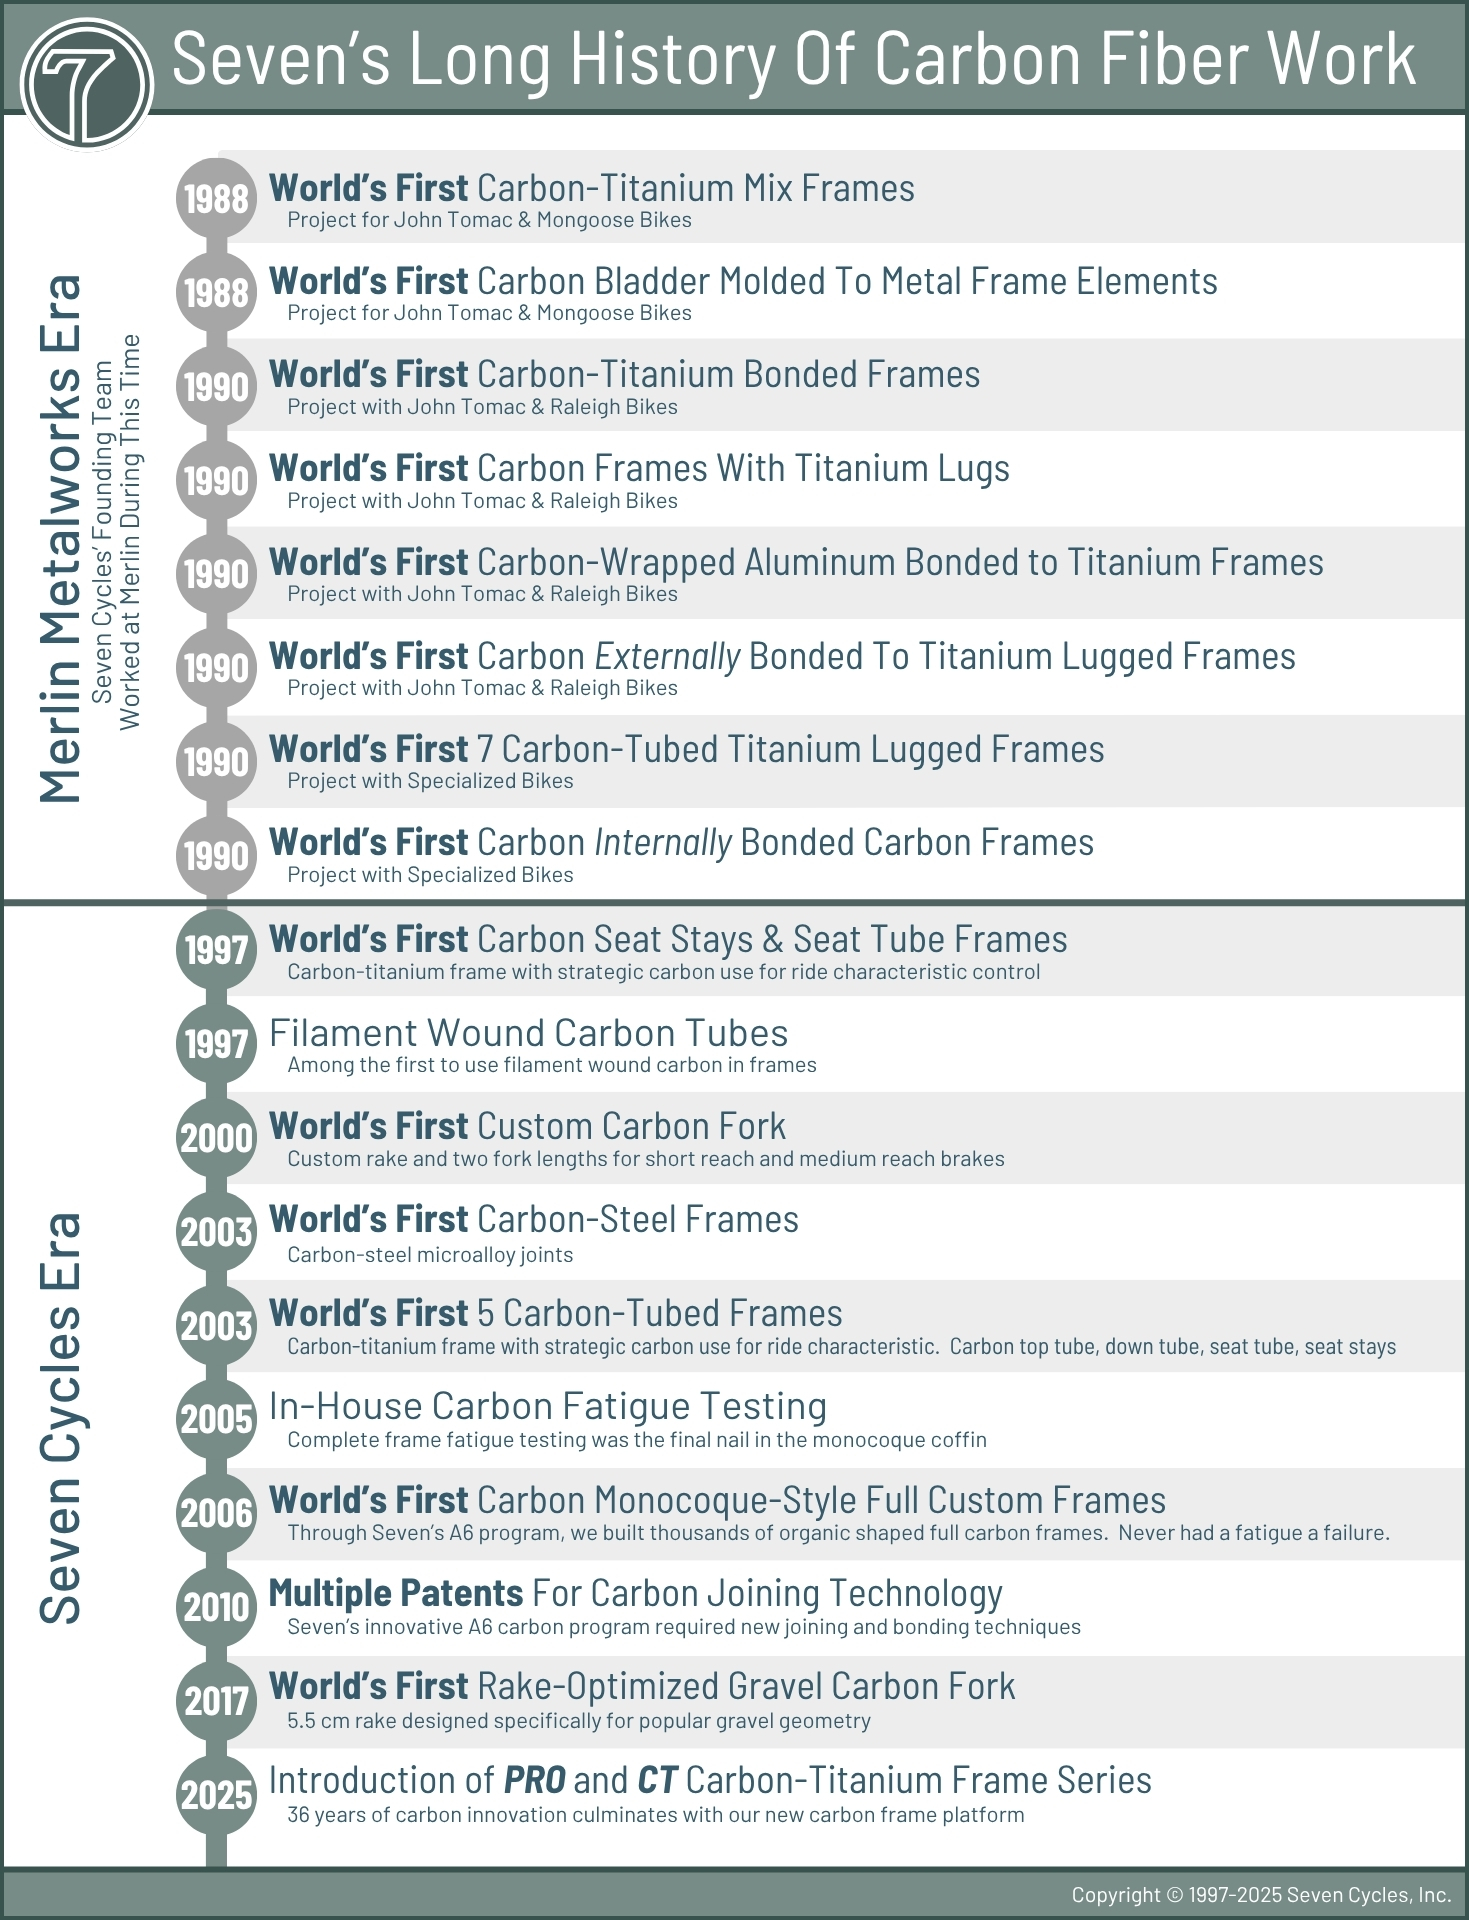
Many riders think of Seven as a titanium framebuilder. However, Seven's founding team has also been building with carbon for 38 years and was involved in creating some of the world's first and most influential full-carbon and carbon-metal frames.
Carbon fiber suppliers and framebuilders don't talk about the shortcomings of carbon frames; their interest is in selling carbon bikes. It is all they offer in the high-end market. The reasons for this monolithic material offering are not about building better bikes; the primary reason is about visual marketing differentiation.
Seven Cycles, on the other hand, can be unbiased about the strengths and weaknesses of frame materials. We build framesets of both carbon fiber and titanium. We also have carbon experience that few others do, with numerous world firsts in carbon framebuilding. We hold carbon framebuilding patents and possess a wealth of relevant experience. Read about Seven's history of innovation and experience with carbon framebuilding.
Carbon Bike Performance Is Getting Measurably Worse
What is bike "performance?" Carbon lore goes something like this: Get carbon because it's aero. Get carbon 'cause it's faster. Get carbon if you want the lightest bike. Get carbon because it's the stiffest. Get carbon because it's what the pros ride.
These statements are mostly accurate in some sense and are among the primary reasons that carbon bikes perform poorly.
Carbon Bikes' Aerodynamics only have meaningful benefits in wind tunnels. In the real world, riders can expect single-digit watt savings compared to non-aero bikes.
Real World Watts
If a wind tunnel shows 25 watts of benefit, 1.5 watts can be expected in the real world out on the road (and less on gravel). (Figure: Only 3 Watts, below.) The reasons for this 94% discrepancy include 1) riding in a pack or echelon, 2) rider on the bike, 3) riding at 20 mph, not 34 mph, 4) cross winds or yaw, 5) aero wheels, 6) climbing up those hills, and 7) road conditions and climate.
Scrubbing Speed
As the Aero Slow Roll figure illustrates, aero bike speeds are often slower than regular bike speeds. Even more critical, aero shapes make the bike ride harsher, sap rider energy, extend recovery time, and make the bike more difficult to control.
Wind Tunnel Testing: Rider on Bike, Bike Only, or Dummy Legs?
The rider heavily influences bike aerodynamics. The rider's legs put the rear half of the bike in dirty air, so there's barely any aero advantage from the seat tube back. The rider's hands and arms also impact handlebar aerodynamics. In short, putting a rider on a bike cuts the bike's aero advantage by about two-thirds.[witfcn1]
As relates to the rider, wind tunnel testing is typically done in one of three ways:
- Bike with no rider. This is the most common testing method because it's easily repeatable with the fewest variables.
- Rider on bike. This most closely replicates real-world aerodynamic conditions. However, it's difficult to replicate position from bike to bike, and therefore, the resulting data has more noise to contend with.
- Dummy legs on bike. This is the method that Tour Magazine employs in wind tunnel testing. Tour is the most prolific wind tunnel tester. As they state, "Since the upper body is not present in the measurement, the drag of a real rider is about 50 percent higher." [arbttm1]
Each method has benefits and shortcomings. Seven is only interested in real-world aerodynamics, so whenever possible, we apply rider-on-bike aerodynamics.
Impact of Each Type of Wind Tunnel Testing
| Bike alone | Dummy legs | Rider on bike | |
|---|---|---|---|
| Bike alone | -- | Bike alone is 148% more efficient than dummy legs.[arbttm] | Bike alone is 295% more efficient than a rider on bike.[witfcn] |
| Dummy legs | Dummy legs are 68% as efficient as bike alone.[arbttm] | -- | Dummy legs are 200% more efficient than a rider on bike.[arbttm] |
| Rider on bike | Rider on bike is 34% as efficient as bike alone.[witfcn] | Rider on bike is 50% as efficient as dummy legs.[arbttm] | -- |
Sources:
★ Sevens Are Faster, Sans Aerodynamics ★
Seven Cycles removes the aero myopia, thereby providing framesets that are faster because they handle better, offer more confidence, provide valuable sensory feedback, and allow athletes to recover faster.
Carbon is Fastest in marketing, not in the real world.
Most people think speed comes from lighter weight, higher frame stiffness, and aerodynamics. That accounts for about 10% of real-world speed.
A combination of factors determines speed. Unfortunately for carbon framesets, as the Not So Fast figure reveals, traction and tracking are worse, and aerodynamics cause trouble. Hence, the bikes are harder to control, resulting in significantly more crashes and slower speeds to counteract handling issues. Climbing speeds have declined in the World Tour road scene. Descending speeds decline as bikes get lighter. Real-time rider recovery is worse, and therefore, optimal performance, including riding faster, suffers.
Aero and lightweight are far down the list of traits that make a high-performance bike faster in real-world conditions.
Real World Speed
Employing online calculators to determine watts saved from optimizing your CdA (coefficient of drag times frontal area) is never replicable in real-world group riding. Meaning, 1) riding in a pack or echelon, 2) with a rider on the bike, 3) riding at 20 mph, not 34 mph, 4) varying road and terrain conditions, and 5) climbs that become descents.
★ Sevens Are Faster ★
Speed comes from the attributes that Seven focuses on: drivetrain stiffness, bike control, sensory feedback, and on-ride recovery time, not generalized stiffness or the aerodynamics that marketing praises.
"Carbon is Lightest" is a claim that a few carbon frames can make. The lightest carbon-framed bikes are about 0.4% lighter than an average Seven — that includes rider, gear, electronics, and hydration. (Maths for 0.4%.)
Fortunately, saving grams has no meaningful benefit on a performance bike of about $7,000 or more. (Grams vs. Dollars.) Yes, as bikes get lighter, climbing speed improves on paper, but as the Light, Not Fast figure illustrates, lighter ends up slower:
- Climbing speeds are getting slower in the pro peloton.
- Descending speeds are slower as the bike (and rider) get lighter.
- Instability results from the frame's stiffness degradation with each ride.
- The lightest bikes are often the most difficult to handle.
- Superlight carbon makes the bike ride harsher. (Counterintuitive, but true nonetheless.)
- Lighter means fragile, not faster.
"You are choosing short frame life"
And maybe the nastiest secret of them all, performance carbon road bikes are considered Condition 1 riding. This means the frame is so light that the rider should expect it to be disposable, likely to fail in a crash, and to have an unreasonably short service life. Is this temporary bike worth saving 200 grams?
We Can All Count Grams
Riders and media focus on lightweight because it's easy to measure. Anyone with a scale can participate in that competition. If, instead, you'd rather compete with your friends or pro racers, day after day, chasing lighter weight has negative value.
★ Sevens Aren't Lighter, They're Faster ★
Sevens are among the lightest bikes, and Seven doesn't focus on weight unless it provides a measurable performance benefit. In the high-end bike world, saving meaningful grams is difficult without negatively impacting performance.
The lightest bike is pointless if it doesn't provide improved performance: Either better climbing, additional confidence on descents, more surefooted in technical conditions, or spare speed on the flats. Lighter weight in high-end bikes provides none of these things.
Regardless of a carbon frame's light weight, it's still harsh, and that beats up the rider. Seven's approach to titanium enables more effective rider recovery for speed over the long run.
"Carbon is Stiffest" is a claim that's demonstrably not true.
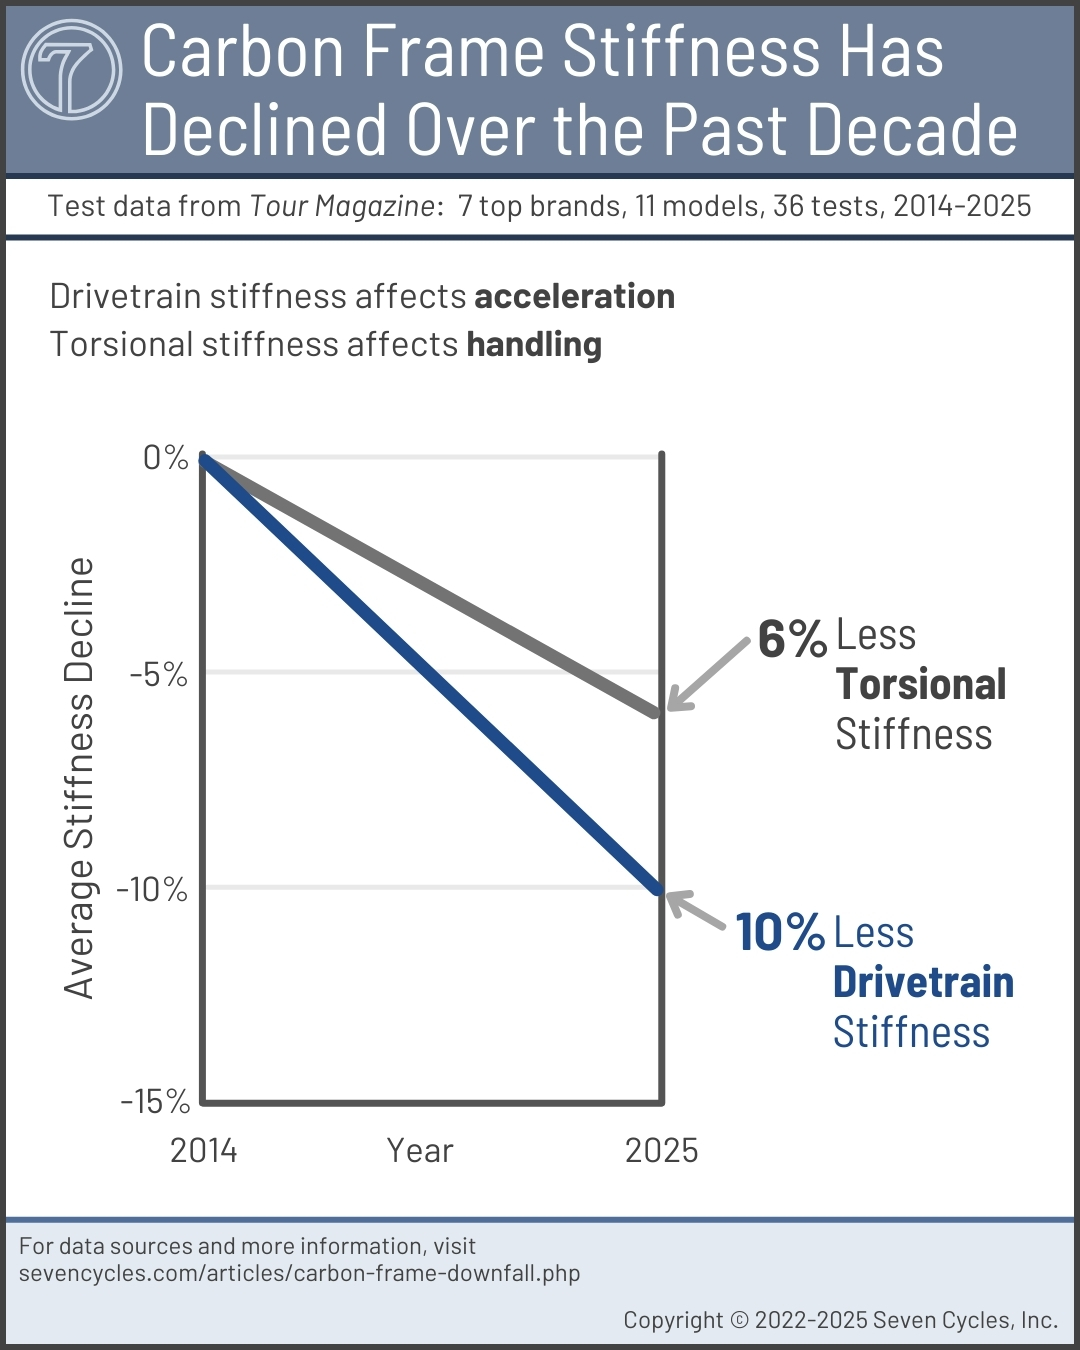
Choosing Less Drivetrain Stiffness:
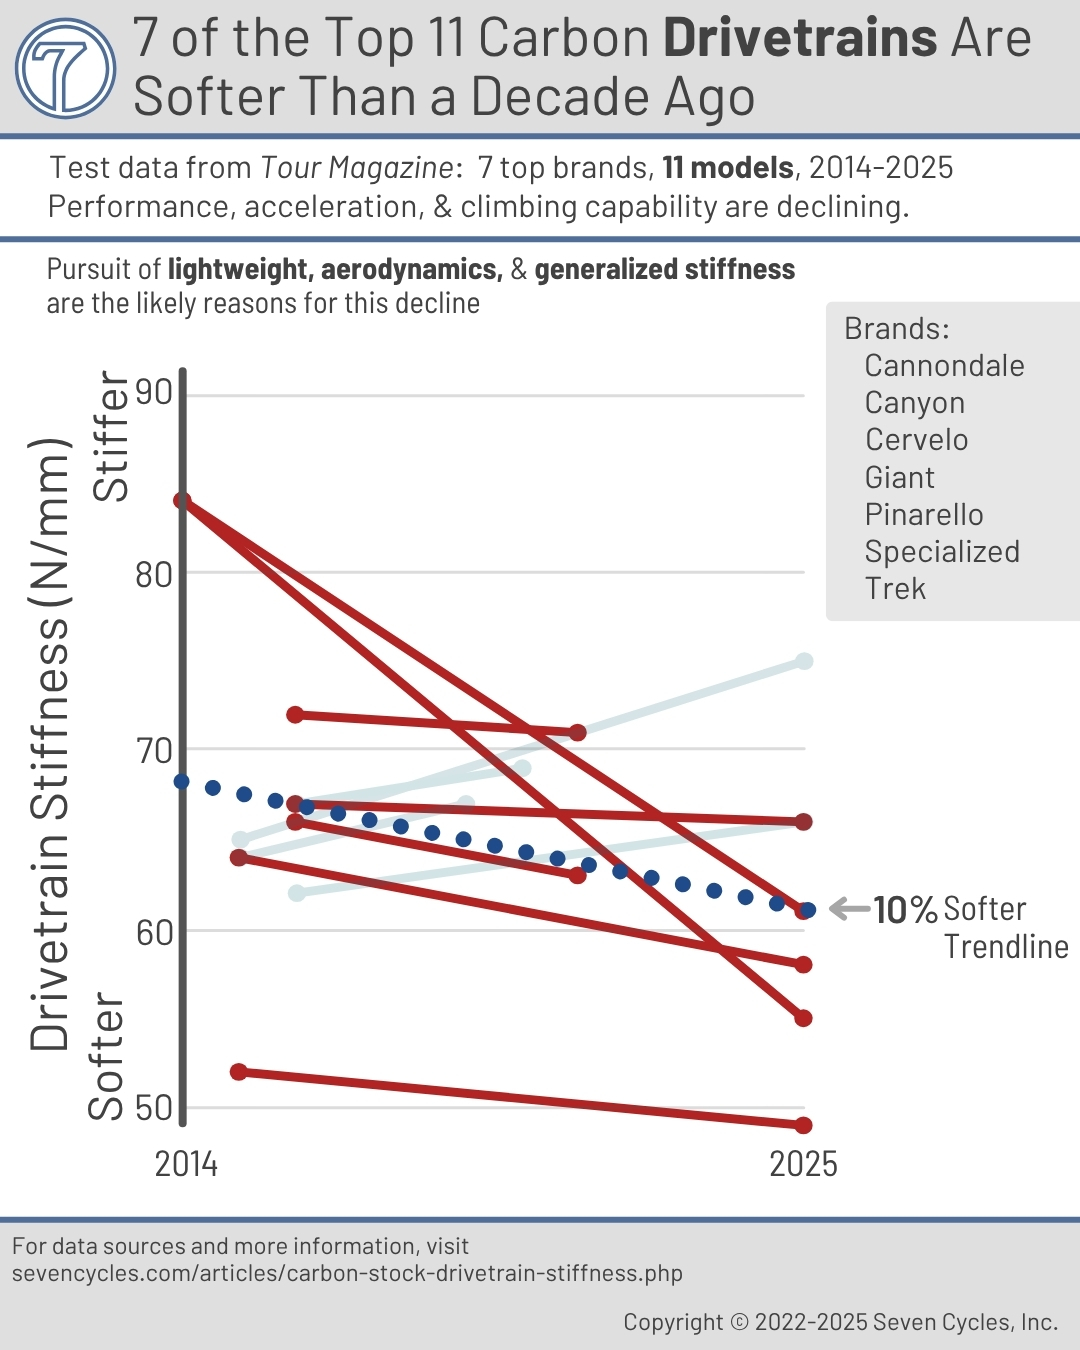
As the Less Stiff This Decade figure illustrates, carbon bike designers are choosing less and less stiff drivetrains (primarily to save weight) with each frame generation. This decision has resulted in an average 10% softer drivetrains over the past decade. Some of the most popular models have drivetrain stiffness losses of 20% or more.
Stiffness Degradation From Riding:
Carbon becomes more flexible the more it's ridden. After a year of riding, a carbon frame is measurably less stiff than it was on day one.
Not All Stiffness Is the Same:
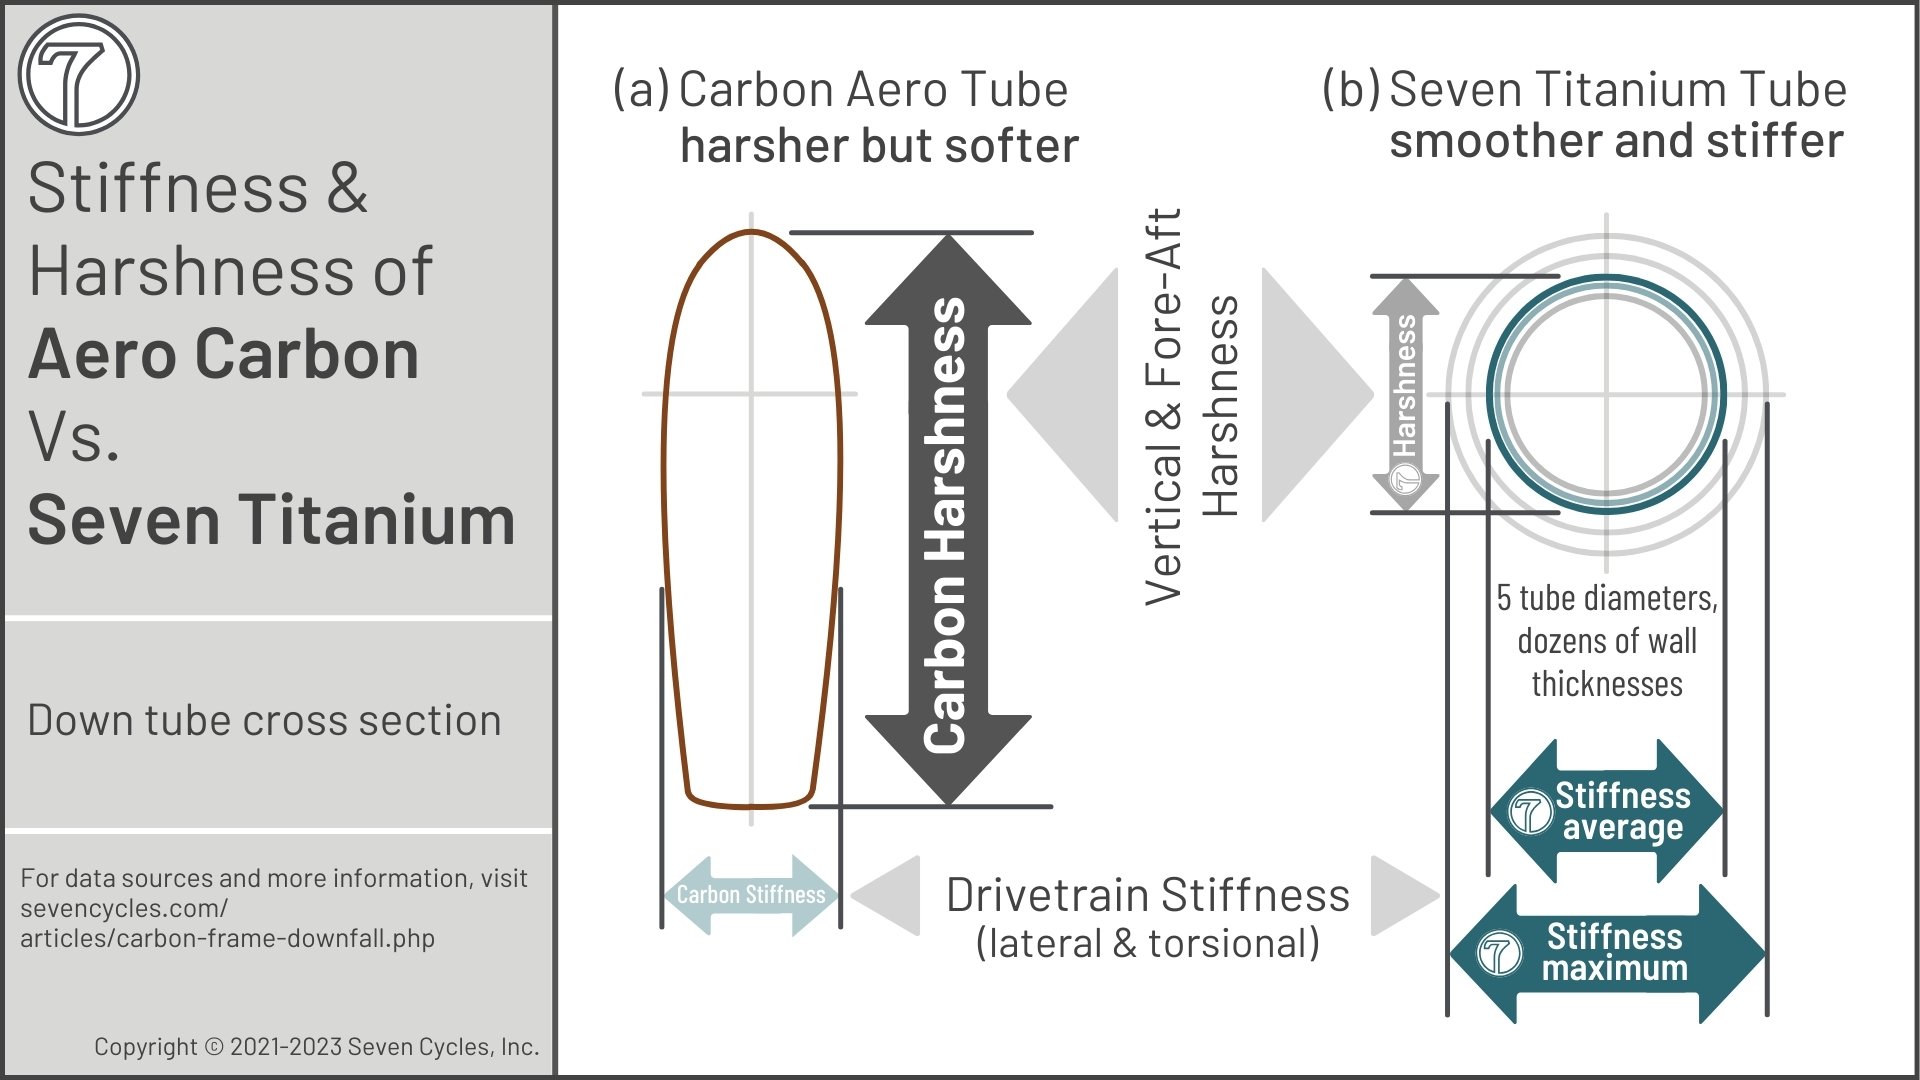
In bikes, there's vertical stiffness (resulting in a harsh ride) and lateral stiffness, (resulting in a stiffer drivetrain for better acceleration, climbing, and sprinting). The latter is good, the former is bad. Carbon frames are vertically harsher than ever, even though they are laterally more flexible than ever. That's the opposite of high performance.
★ Sevens Are Stiffer Where It Matters ★
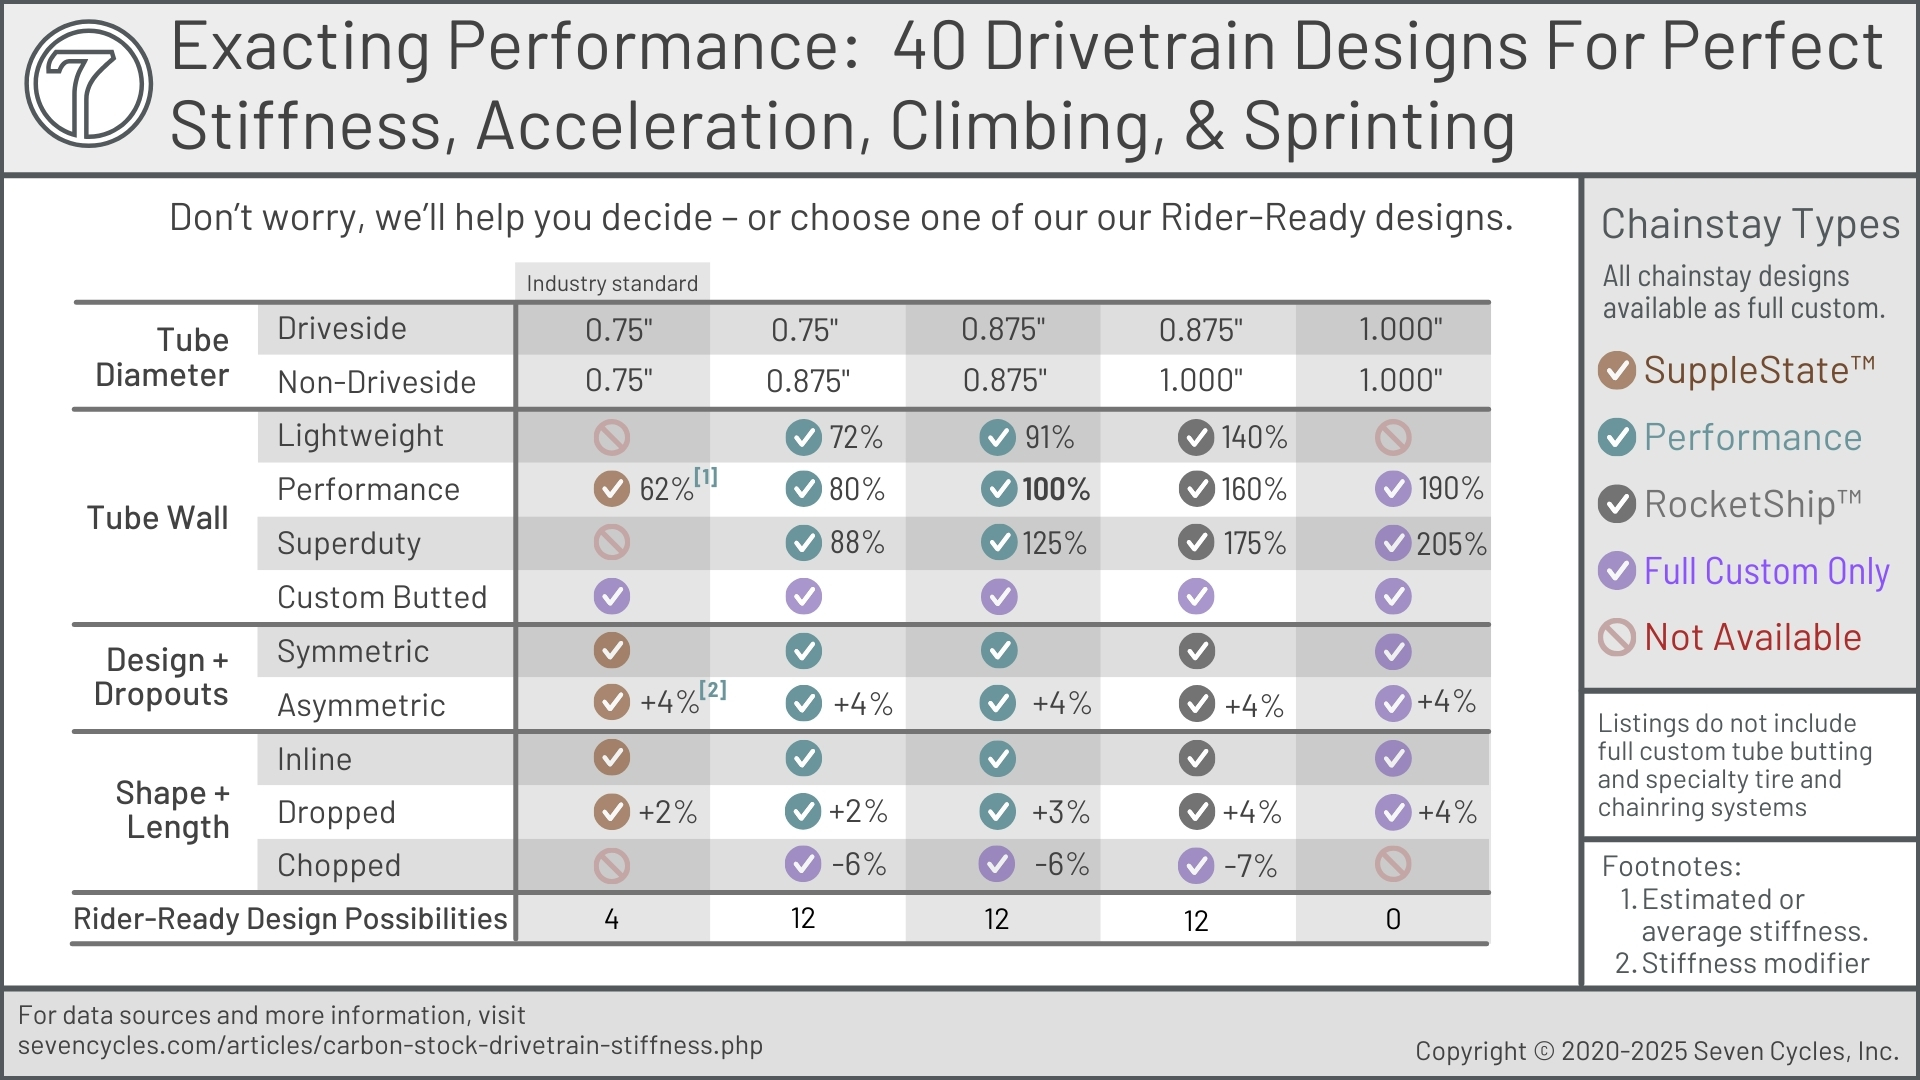
Drivetrain stiffness is a key factor in bike performance. Seven has over 40 drivetrain design offerings to tailor and tune the frame's performance.
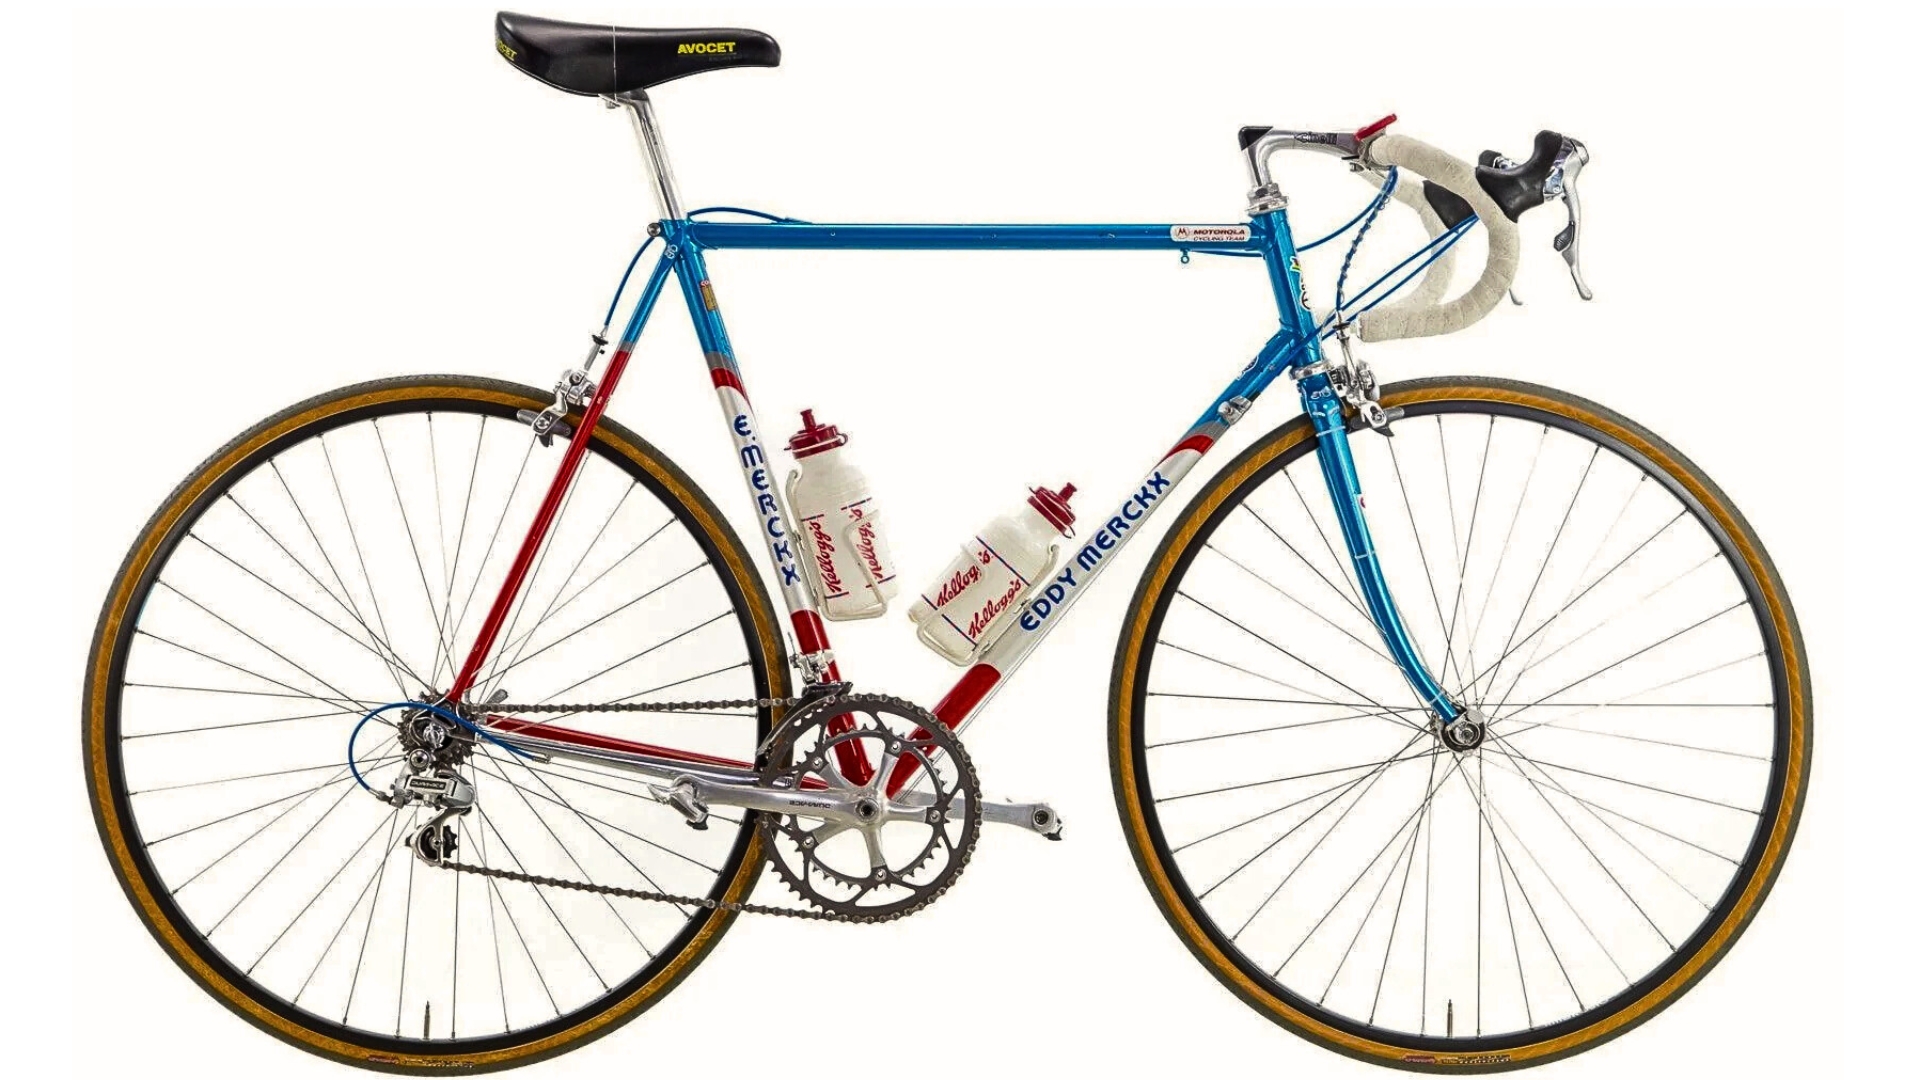
Pros ride carbon bikes. True. They get paid to ride what bike brands want to sell. That means carbon because the frames are inexpensive, simple to differentiate visually, and uncomplicated to manufacture overseas. Would pro racers be faster on metal bikes? The data indicates the affirmative: speed data, aero comparison data, and UCI crash and injury data show that carbon bikes are slower and more dangerous.
★ Riders Ride Sevens ★
We currently don't sponsor any pros or pro teams. Historically, Seven has sponsored dozens of world champions, national champions, Olympians, and FKT riders of all stripes. Nowadays, we invest our entire budget into product development and testing. Additionally, our co-workers are the best product testers; insightful, always available, and with decades of experience.
Less Stiffness, More Harshness, And Degrading Performance
The stiffer a frame is in the vertical plane, the harsher it will ride. However, for performance, riders benefit from lateral-plane stiffness (drivetrain), which provides better acceleration, faster sprinting, and quicker climbing. As the Stiffness Backwards figure is titled, carbon frames get stiffness backwards, with more vertical and less lateral.
Carbon Rides Harsh but Not Stiff
It's easy to confuse a harsh ride with a stiff ride. However, in many ways, they are opposites.
Harshness
Harshness is stiffness felt in the bike's vertical plane. Harshness has several downsides and no upsides. Smart frame designers want to minimize harshness. The downsides of a harsh ride include reduced rider recovery, slower sustained speed, poor handling and control, and dampened sensory feedback.
The reasons carbon frames ride so harshly include aerodynamic aesthetics and a need for generalized stiffness.
Stiffness
Drivetrain stiffness (what riders want when they talk about stiffness) is in the bike's lateral plane and does not contribute to the harsh feel of the frame. More stiffness here is almost always good. The downsides are added weight and less tire and chainring clearance (or longer chainstays).

The Need for Generalized Stiffness
Generalized stiffness is Seven's term for one of the primary and intractable issues with carbon frames.
As illustrated in the Stiffness Backwards figure above, carbon frames must distribute stiffness suboptimally. The frame requires too much vertical stiffness (to defer failure) and, because frames need to be so light these days, there's not enough drivetrain stiffness.
The result is a frame that is generally stiff, but not stiff enough laterally and too stiff vertically, the worst of all worlds.
★ Seven's Differentiation Regarding Stiffness and Harshness ★
To achieve optimum stiffness and ride feel, Seven engineers independently design each frame's three planes through tubeset design. This is in opposition to carbon frame characteristics as shown in the Stiffness Backwards figure.
Rather than generalized stiffness (required in carbon frames), we use targeted stiffness. We isolate each plane for optimum performance:
- Torsion: The side-to-side rotation plane provides bike control and handling surefootedness.
- Vertical: The vertical plane provides Frame FlowTM and rider recovery.
- Torsion and Flow combined provide sensory rider feedback.
- Lateral: The drivetrain has little influence on ride feel and feedback. We can focus here on forward momentum and watts transfer to the rear wheel. Stiffer in this plane is generally better.
Designed With Less Drivetrain Stiffness Year After Year
Marketing tells us carbon frame drivetrains get stiffer nearly every year. The opposite is true. Third-party data is clear: over the past decade, carbon drivetrains have become, on average, 10% less stiff.
A stiffer drivetrain is almost always a good thing. It improves sprinting, acceleration, and climbing. It helps the rider transfer more watts more efficiently. The only downsides are added frame weight (a red herring as explained below) and potentially less tire and chainring clearance (also a misdirection from functional performance).
The Softer Drivetrains figure shows that 7 out of 11 carbon frame drivetrains are more flexible than a decade ago. (One of the three stiffer models was discontinued. Another that got stiffer hasn't been tested in seven years; odds are it's gotten more flexible in its latest iteration because the frame is lighter. Those likelihoods make the softer frame number 80%.)
★ Seven's Drivetrain Stiffness & Performance Differentiation ★
Seven's most popular drivetrain design is about 20-40% stiffer than popular carbon drivetrains. (The drivetrain includes the chainstays, dropouts, bottom bracket, and some stoutness coming from the down tube and seat tube. This entire system dictates drivetrain performance.)
Seven's stoutest drivetrain is more than 200% stiffer than the average carbon frame tested by Tour Magazine.[tm01]
This level of stiffness isn't ideal for every rider and riding style. That's why we offer over 40 drivetrain designs with endless tube profile options. We tune the drivetrain stiffness to the rider's needs. For example, even our Rider-Ready drivetrains are engineered size-specific, model-specific, and component-optimized. ★
Riding Carbon Induces Immediate Stiffness Decline
Carbon laminate stiffness degrades almost immediately upon the introduction of cyclic load — pedaling a bike, for example. Soon after, the structure begins its inevitable, slow slide to ever-increasing flexiness until the frame fails or is replaced.
This performance degradation is caused by microcracking in the resin (the glue that holds the fibers together) of the carbon laminate. Microcracks lead to macrocracks with one of two outcomes. Either the structure fails (macrocracking) or the frame becomes increasingly flexible (continuing microcracking).
The cause of resin cracking is its dreadfully low fatigue strength. Resin's fatigue strength is only 10% of that of aluminum 6061; in practice, that's not functional strength. The resin begins its failure journey on the first ride.
Titanium, on the other hand, as shown in the Carbon Stiffness Declines Over Time figure below, exhibits no modulus degradation over its service life. The frame's stiffness characteristics on the first and 10,000th rides are identical.
Carbon laminate's stiffness degradation is well documented by NASA and a hundred other businesses and universities. Even the bike industry knows this. The International Organization for Standardization (ISO) 4210 fatigue life test standards for carbon bicycle forks states that carbon is considered failed at a 20% reduction in stiffness::
"Conclude the test if the running displacement [...] increases by more than 20%."
The DIN 14781 test standard for frame fatigue reads the same as forks — a 20% decline in carbon stiffness means the frame failed the test:
"For carbon-fibre frames, the peak deflections during the test [...] shall not increase by more than 20% of the initial values."
The DIN standard has been superseded by the ISO 4210 standard but that doesn't render the DIN test standard irrelevant.
★ Seven's Titanium Engineering Differentiation ★
Titanium stiffness never degrades from use, as the Carbon Stiffness Declines Over Time figure above illustrates. Additionally, Seven's titanium specifically (and the way we process our alloys and design for endurance) provides the highest fatigue strength of any titanium alloy.
★
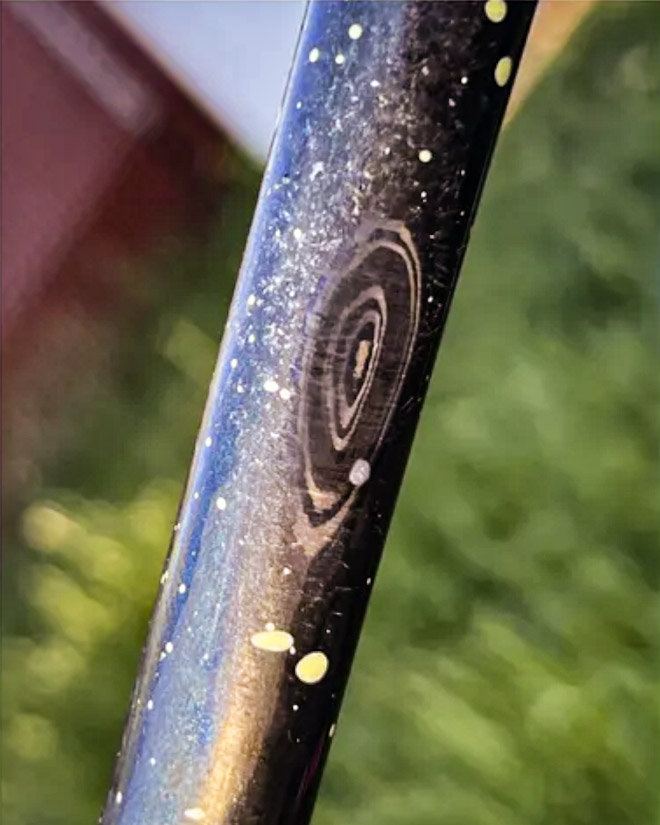
Damage Intolerance: Abrasion & Wear Issues
Mud, sand, grit, debris, frame bags and straps, chain drop, and even shoe heels all abrade carbon fiber. Carbon can wear to failure rather unexpectedly and quickly.
A recent video from Ben Delaney, executive editor of VeloNews, provides some insight into carbon's debilitating wear issues.[trwbd] Speaking about the Unbound gravel race, Rob Smallman of CeramicSpeed said of carbon bikes,
"We saw pictures of people with holes in the seat stays, chainstays, and seat tubes. Physical holes, you could see inside the frame."
Ben also interviewed Brady Kappius, founder of Broken Carbon Repair Shop. They repaired numerous bikes after Unbound, stating,
"Any [wear] more than one layer of carbon, get that repaired. [...] when you get to the second layer of carbon. Yeah, it's in your best interest to get that patched."
For reference, in the bike world, a layer of carbon prepreg fabric is about 0.010" thick. That's about the thickness of three sheets of paper. It doesn't take much time or effort to wear through a single layer of carbon.
The Abraded Stay photo shows layers of carbon worn away by a muddy tire. The damage occurred in a single day's ride at Unbound. The bike should not be ridden without repair. The photo is from an article in Cycling Weekly, "Unbound Gravel destroyed my bike."[ugdmb] The author, Anne-Marije Rook, discussed the damage done.
About her own bike, she wrote,
"On the chainstays, seat stays and seat tube, the grime and grit had worn through [...] most of the carbon."
Of the race more generally, she wrote,
"[The mud] clogged bikes almost immediately, [...] cracked frames and caused all-around carnage. This meant that a significant number of riders never reached the finish line."
Is this a risk worth taking? If you live in an area that gets rain once in a while, mud and grit can become issues. Regardless, every bike is likely to have chain drop, frame bags, and various abrasive straps at some point.
★ Seven's Toughness Differentiation ★
Seven's unique carbon frame design makes abrasion-type failure very difficult. All carbon-titanium Sevens have titanium drivetrains (including dropouts, bottom bracket, and chainstays) because that's where the frame is most susceptible to abrasive wear and chain damage. We've never had a chainstay wear through on a properly set-up bike.
★
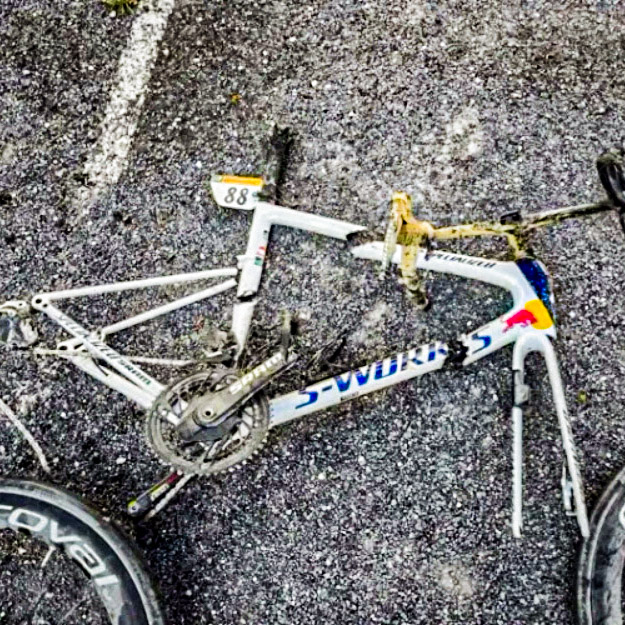
Damage Intolerance: Impact & Fragility
Carbon fabric, filled with resin and formed into thin-wall tubing, is not damage-tolerant compared to metal tubing. Crashing the bike, dropping the chain, dropping a wrench onto the frame, or the bike falling over. Any are likely to end a carbon frame's life.
Outside Magazine's article, "Why Carbon Fiber Bikes Are Failing," discusses carbon fiber's failure mode and concerns about it.[wcfbaf] Here are some quotes.
"VeloNews reported that several racers [...] suffered crashes after the failure of carbon-fiber steerer tubes, the part that connects the frame to the handlebars. In response, Trek said the problem came from installation and compatibility issues."
These were professional racers with full-time professional mechanics taking care of the bikes. If they can't properly maintain carbon bikes, no one can.
"In a widely reported crash, [a] carbon-fiber frame that split in half [...] it turns out a guy fell on the frame during the crash."
Well, that explains it. A frame should be expected to fail if one falls on it. Well, metal bikes don't fail if someone falls in a crash.
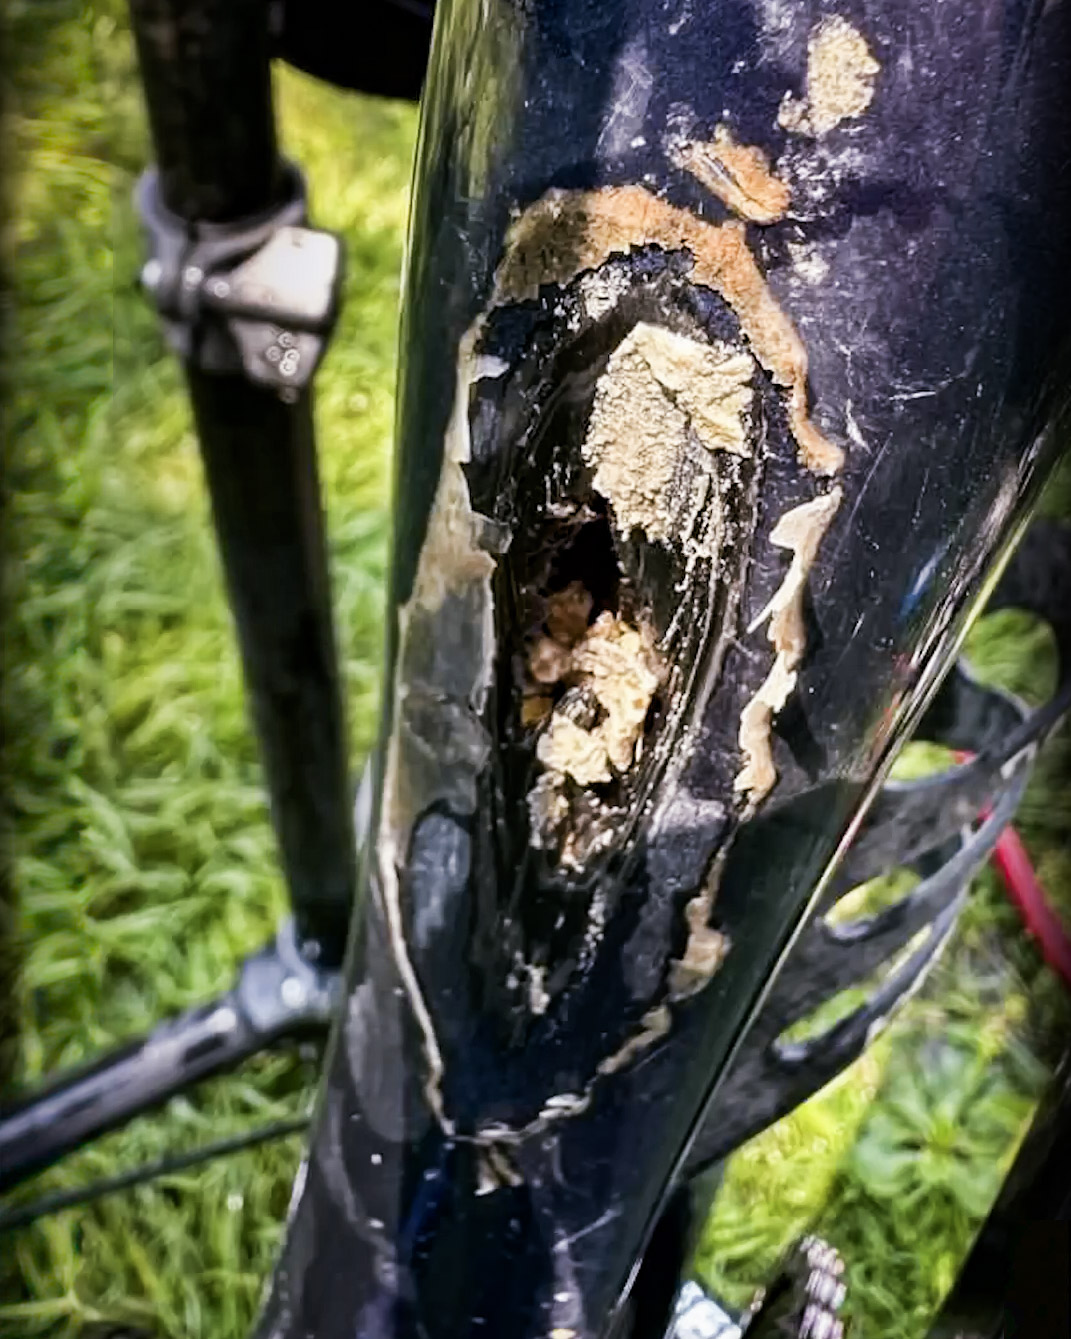
"I've seen accidents from a whole range of carbon-fiber components — handlebars, forks, seatposts, entire frames."
"Even if a carbon-fiber component is well made and has never suffered a routine ding or collision, accidents can occur due to poor maintenance. Unlike with other materials, if you overtighten carbon-fiber parts, they're likely to shatter down the road."
"The consequences of [...] wear and tear underscore the importance of [...] assuring the bike is inspected regularly by someone trained to maintain carbon components."
That's a big ask. What is a "regular" timeframe? What does "inspection" entail, and what's the cost? What does "trained" mean? No carbon builder offers clear answers. More concerning is how few riders know about this requirement, and if they do, do they take it to heart? (The road to the ER is paved with good intentions.)
"[With carbon fiber] it can be difficult to detect signs of damage that might signal imminent failure. What's worse is that when carbon fiber fails, it fails spectacularly. While other materials might simply buckle or bend, carbon fiber can shatter into pieces, sending riders flying into the road or trail. And this kind of catastrophic destruction can happen to any part of a bike made with the material."
Three photos show examples of impact and catastrophic damage: Catastrophic Carbon photo, above; Catastrophic Specialized photo, above; and Catastrophic Cruz photo, below.
Carbon frames are sometimes repairable, but often at a higher cost than expected.
★ Seven's Frame Durability Differentiation ★
Properly engineered and fabricated titanium frames do not catastrophically fail in a crash. Seven goes steps further with extensive fatigue testing, impact testing, and product engineering.
All frames are susceptible to fatigue failure. That's one of the reasons no warranty covers fatigue failure. Fatigue is considered part of "normal wear and tear." If anyone built frames to last forever, they would be so overbuilt, heavy, and harsh that no one would ride them.
All Seven frames have a lifetime warranty, whereas many lightweight carbon frames have a 2 or 3-year warranty. Almost all carbon road frames have a "Condition 1" disclaimer that literally says to expect a "relatively short product life." Which bike would you trust? ★
Carbon Frame Repair: The High Cost of Low Weight
Plan on a total price of $1,000 and $2,000 for a good carbon repair, depending on the damage and how close to original quality you want the frame. The costs typically include some combination of:
- >$150 to strip the parts off the frame, removing the bottom bracket and headset, too.
- $150 to $250 in shipping to and from the repair facility.
- $350 to $600, or more, for the actual repair work.
- $200 to $2,000 to repaint the repaired area. Paint matching can be complex, and making the carbon repair truly paint-ready requires additional hours.
- >$150 Rebuild the bike when the frame is completed. The cost may also require replacing some parts.
★ Seven's Frame Repair Differentiation ★
If a Seven carbon tube gets damaged, we replace the tube rather than patching the issue. One of the many benefits of Seven's 622 carbon-titanium frame platform is that we don't have to do patchwork repairs that monocoque-style carbon frames require. (Most carbon frames cannot survive a tube replacement.) Seven's commitment to tube replacement ensures the frame's original integrity, durability, and ride characteristics. The repair is still expensive, but it's a worthwhile investment for the long run.
★
Carbon Frame Fatigue Failure
Examples of popular carbon durability misstatements that sound impressive include:
"Composite materials essentially have an infinite fatigue life." — Motion Composites[cf101]
"Composites [...] don't actually fatigue like metals [...]. The fatigue life of [carbon] fibre itself is just about infinite." — VeloNews[witls]
"Unlike metals, carbon fiber doesn't fatigue or weaken over time, meaning that it can endure long-term use without losing its strength or structure." — Feral Industries[tsbcf]
We often see statements like these. However, they're not true. It's kind of like saying, "Seawater is just water." It may be true at some first-grade level, but if you drink seawater, you'll regret it. Just like believing that carbon fiber frames don't fail from fatigue, you'll regret it.
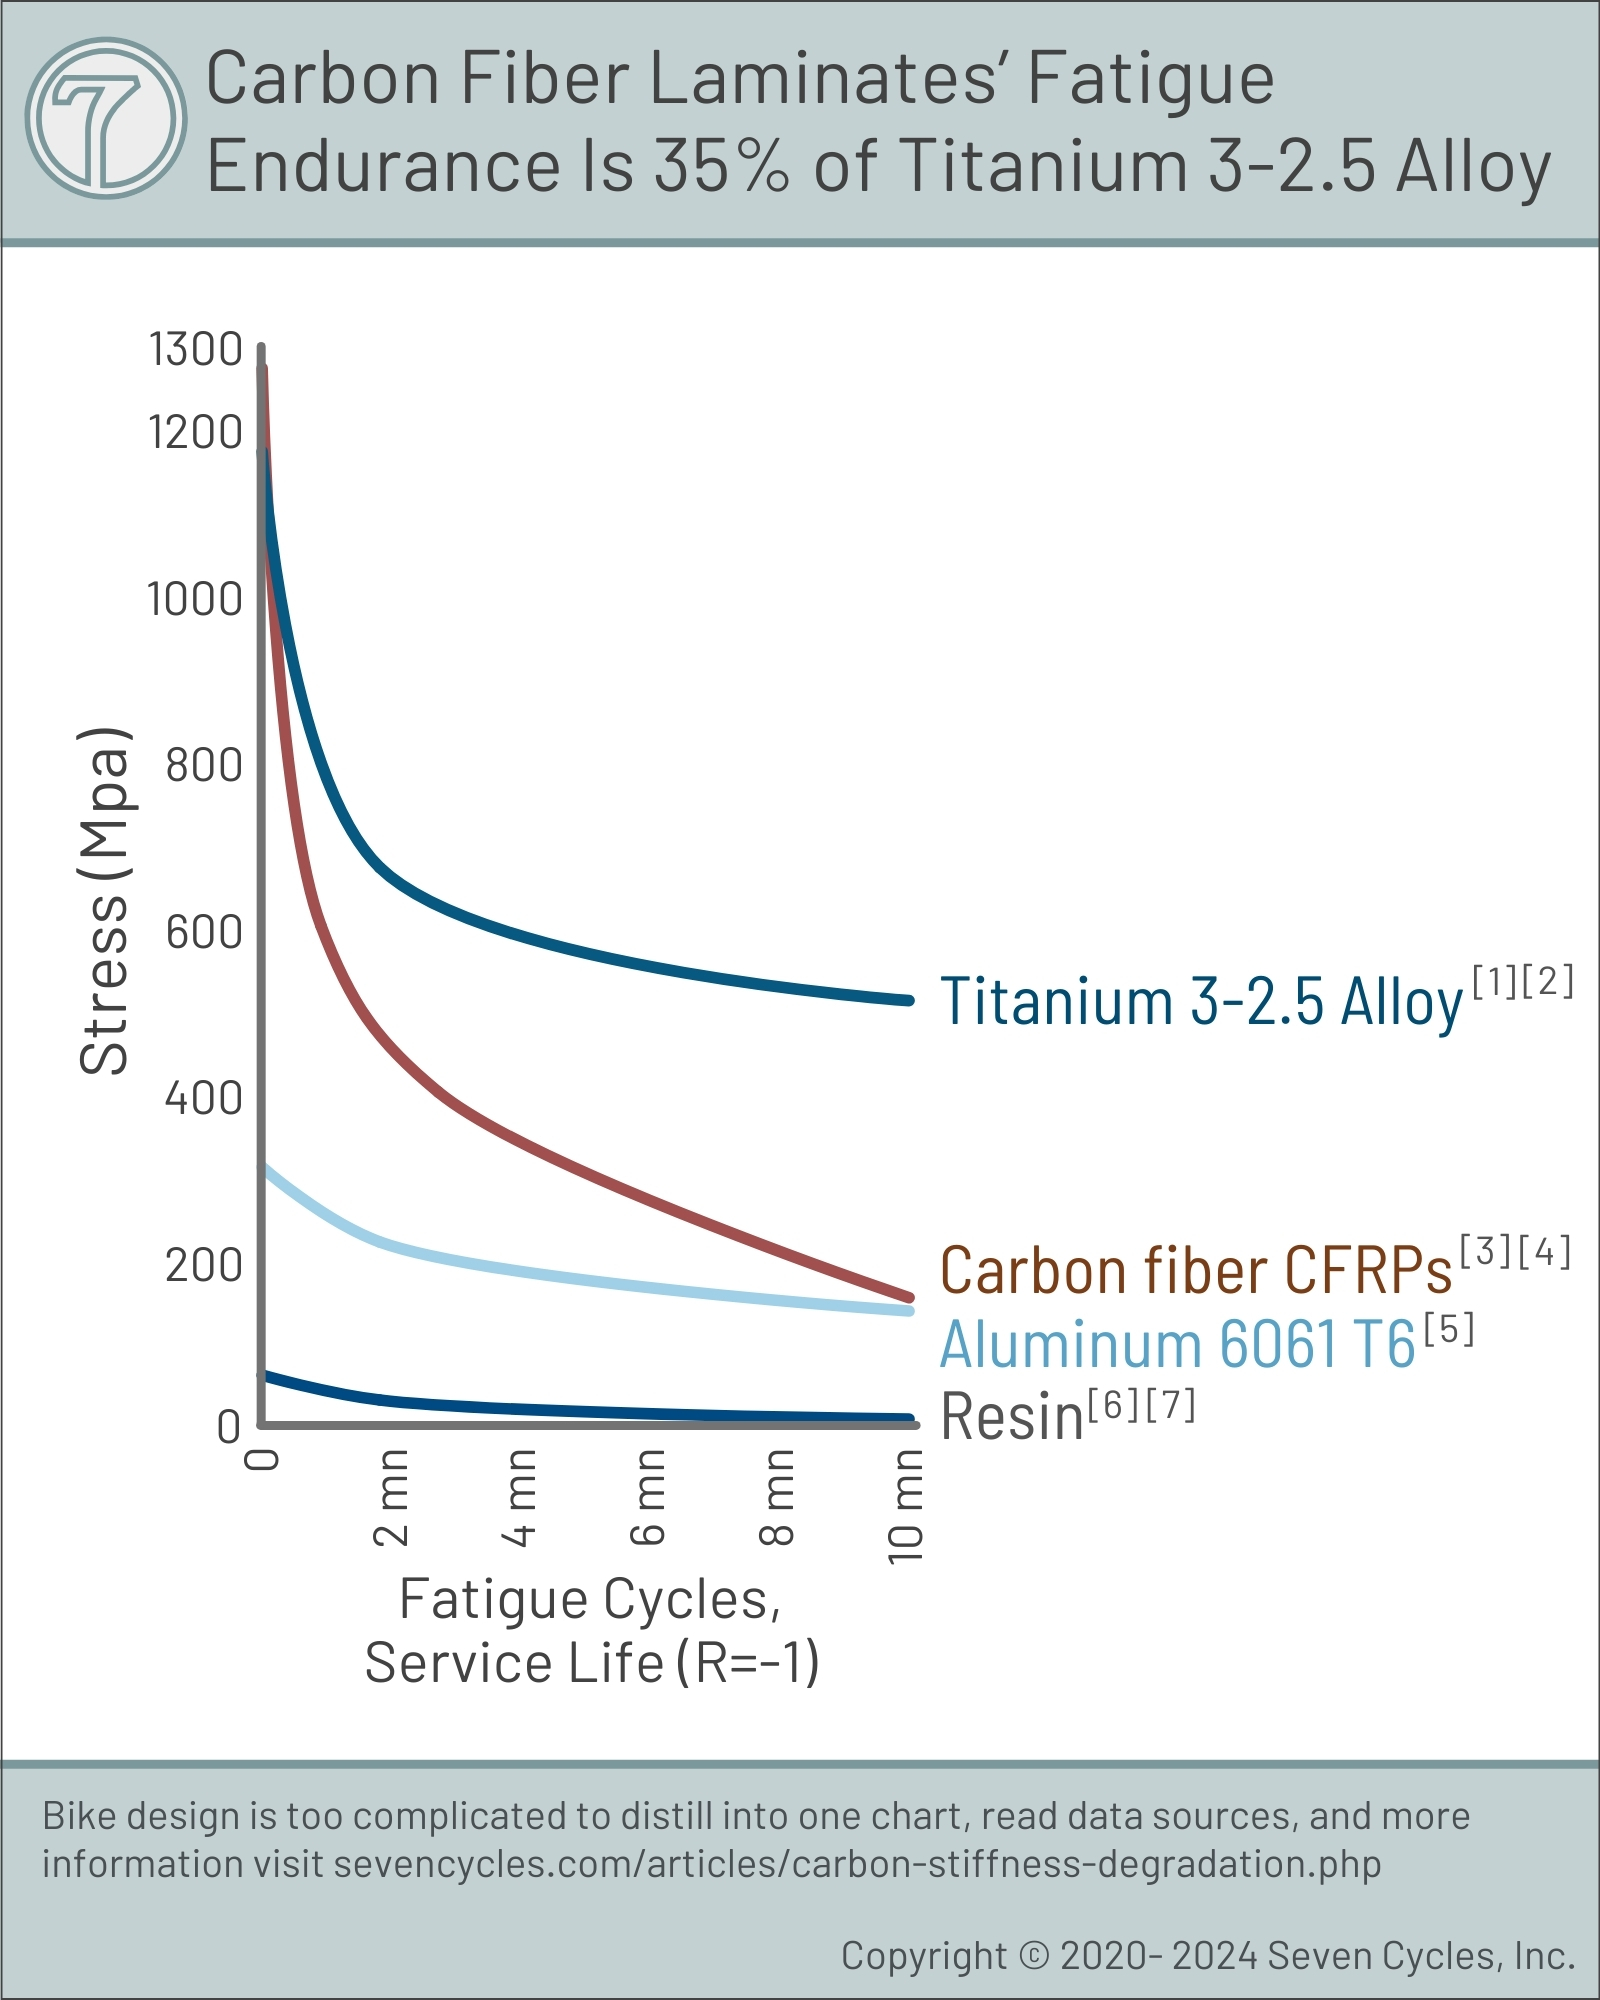
Look at any fatigue data for carbon fiber laminate (carbon fiber plus its required resin), and you'll see that carbon structures have fatigue limits, and those limits are not good. [aa234] [aa239] [ab6910] [ab6924] [ab6925] [va125] [va1411] [tm58] The Carbon's 36% Fatigue figure below illustrates a harsh reality of carbon fatigue strength.
The first problem with carbon fatigue is that a carbon bike frame is at least 50% resin (the glue that holds the carbon together). As shown in the Carbon 36% Fatigue figure, resin fatigue life, for all practical purposes, is nil; it's about 90% worse than aluminum (~20 MPa vs ~186 MPa). (Aluminum 6061 T6 fatigue data.) (2025 epoxy resin fatigue data.) (2007 epoxy polymer fatigue data.) Resin eats about 50% of carbon fiber's potential fatigue strength.
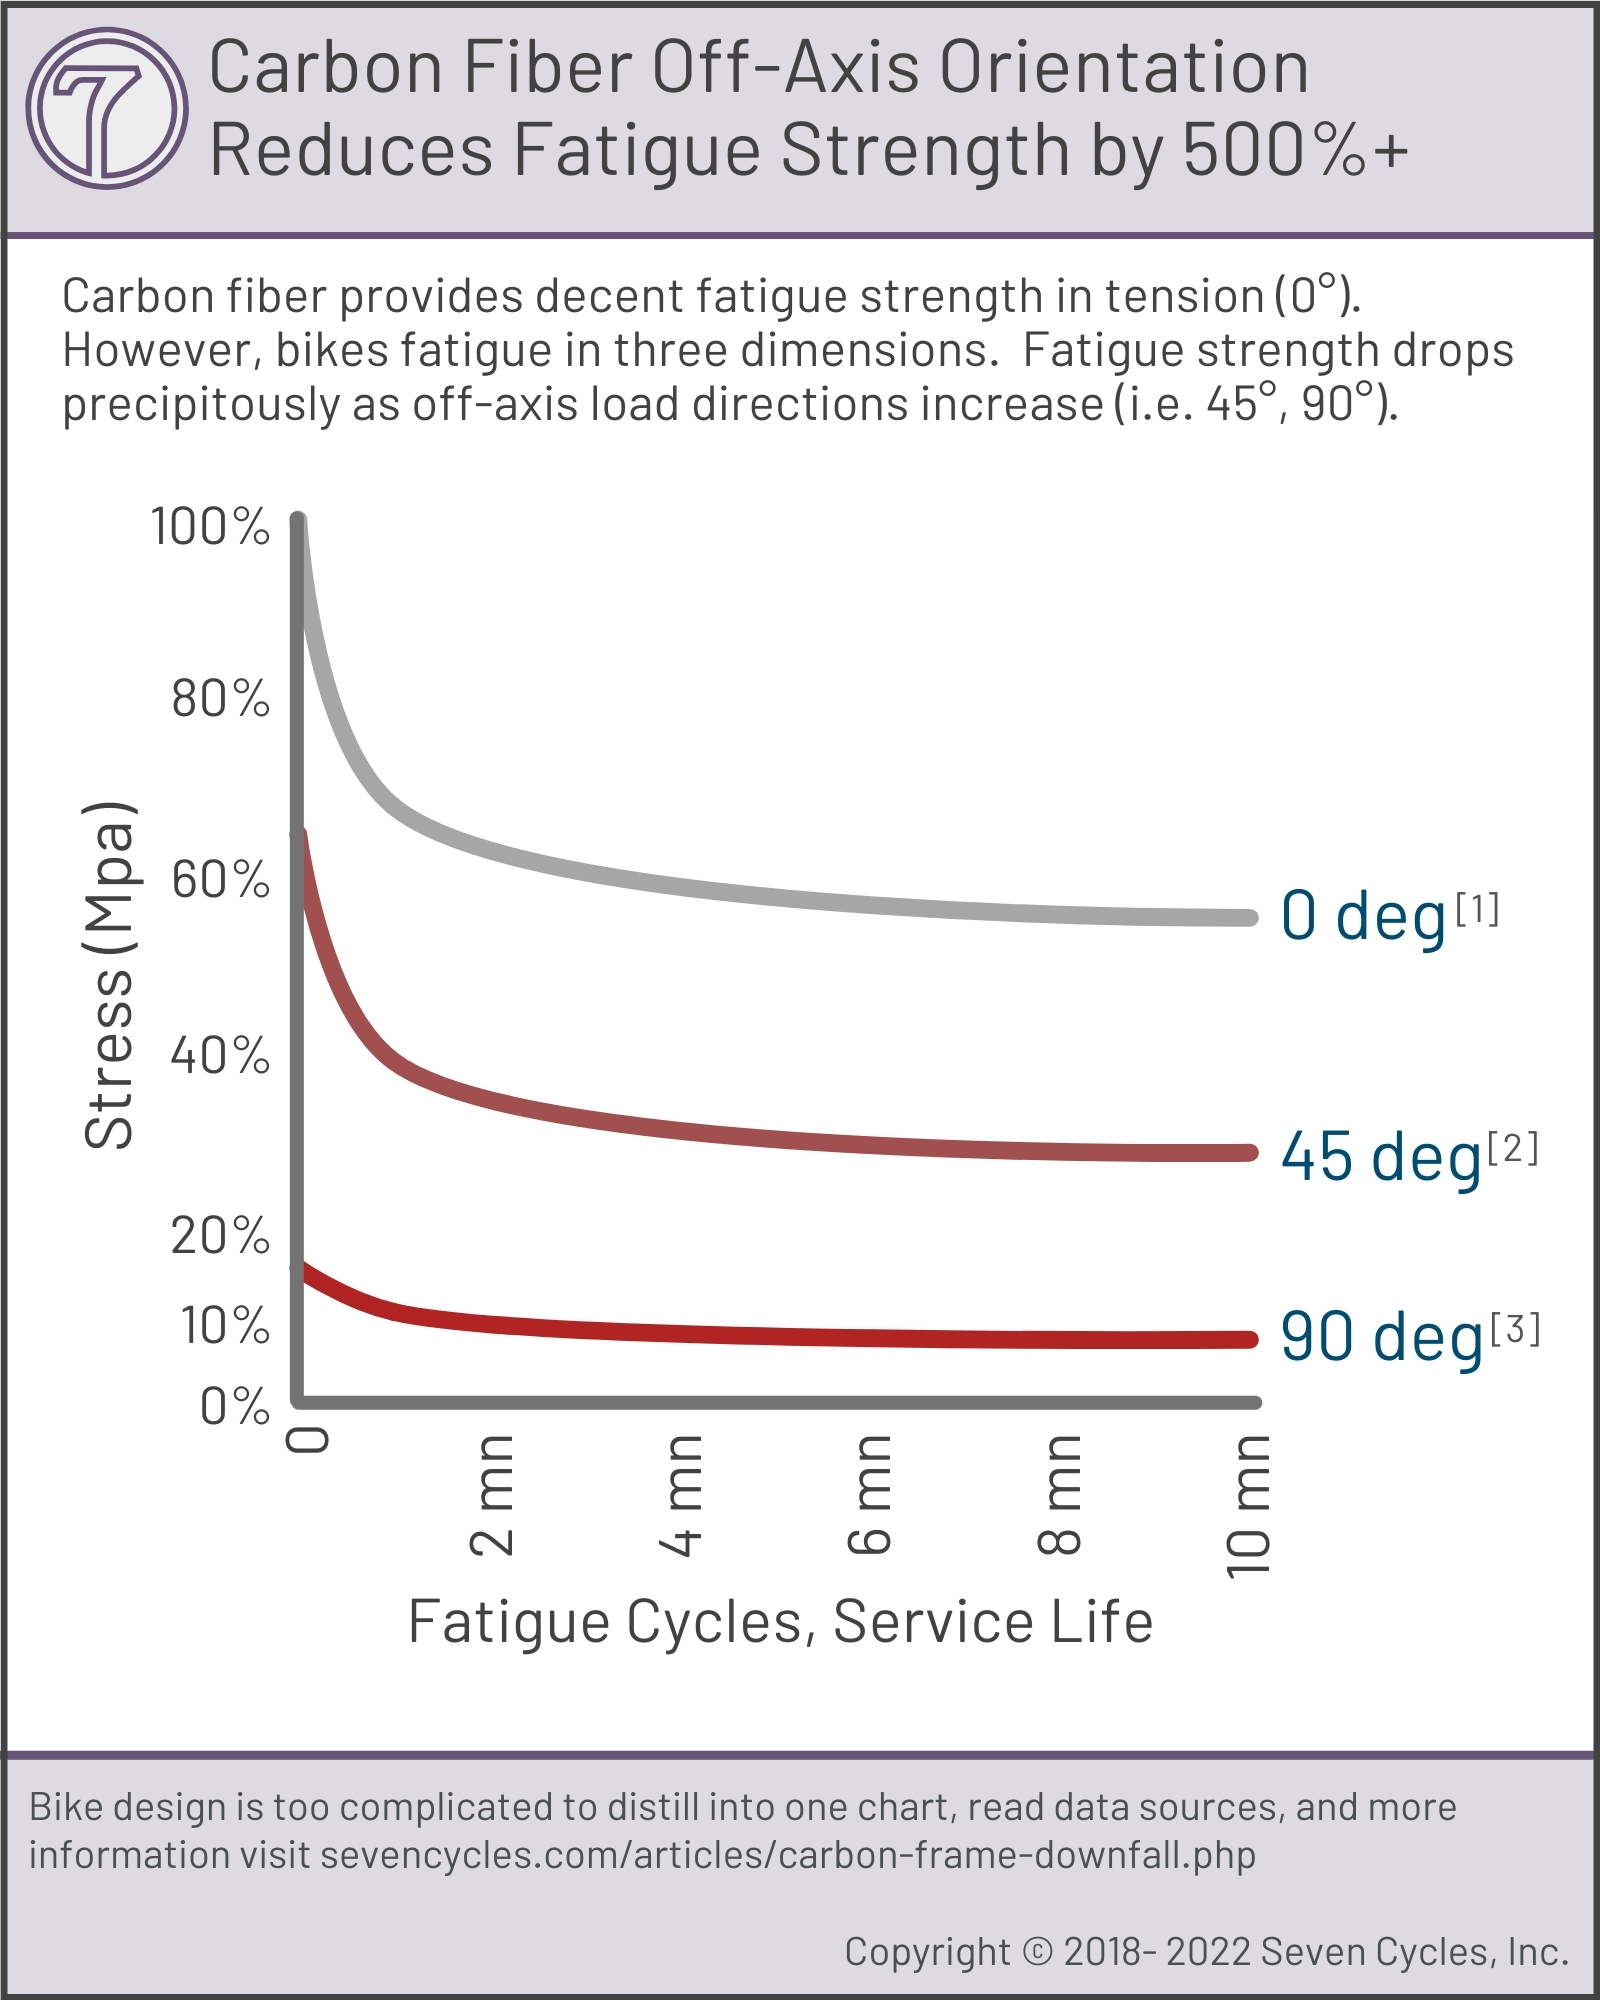
The second problem is that the orientation of bike frame fatigue is not monolithic. It occurs in all planes of the frame. As illustrated in the Carbon Off-Axis Fatigue Drop figure, carbon only has reasonable fatigue strength in its tensile direction (0°), not in any other direction (bending, torsion, or compression). Therefore, carbon is prone to failure in off-axis load situations (i.e. 45°, 90° stress) — like those found in bike frames.
In short, the fatigue life of carbon fiber laminates in three-dimensional bending is poor.
★ Seven's Fatigue Life Differentiation ★
The titanium alloys Seven works with (3-2.5 and 6-4) provide at least 300% better fatigue strength than the best carbon frames (Carbon's 36% Fatigue figure).
Titanium is monolithic in fatigue endurance (equal durability in all axes). Carbon's unidirectional fatigue strength requires 4 to 6 layers to begin to replicate titanium's monolithic properties. This means a heavier carbon frame that's still not optimized for three-dimensional stresses (lateral, tensile, torsional, compressive, vertical).
Not All Titanium Is the Same
Just as not all carbon frames are the same quality, not all titanium tubing is the same. There is good tube processing and bad processing. More importantly, the way the material is handled and worked by the framebuilder has the largest impact on durability. The founders of Seven have been building titanium bikes for nearly 40 years, longer than any other builder.
★
Aerodynamic Bikes Are Slower Than Normal Bikes
Counter to carbon bike marketing, traditional non-aero bikes are as fast or faster in all conditions except wind tunnels with no rider on board. In real-world use, the sleekest full aero bike might save 1 to 2 watts on the road,[12wt] but that is far overshadowed by the inherent performance downgrade of worse or dangerous handling, a much harsher ride, poor post-ride recovery, and a heavier bike.
The Only 3 Watts figure below tells the story with 100% third-party sourced data.
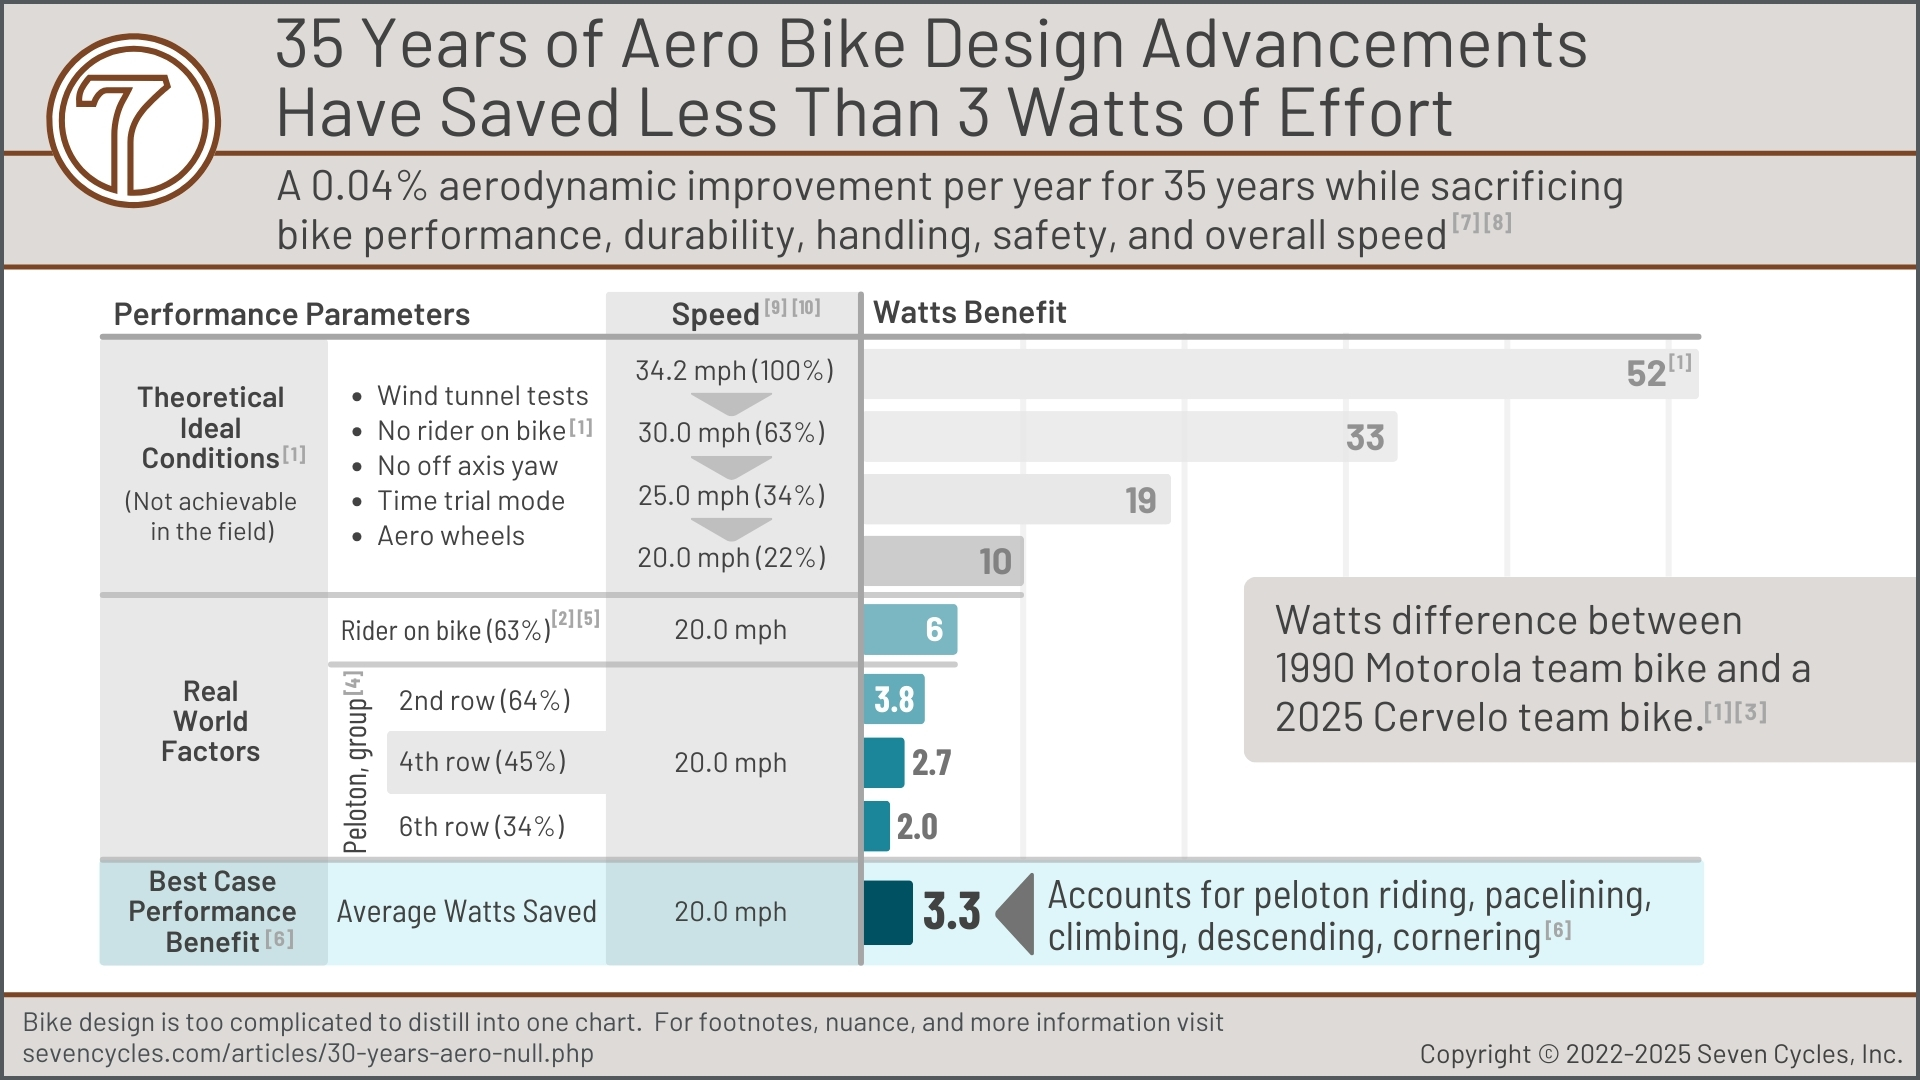
The baseline data in the Only 3 Watts figure above comes from a Velo Magazine article quote:
"[when we wind tunnel tested] a 1990 Motorola team bike and the 2021 Jumbo-Visma bike the results were staggering. Granted, the bikes were tested without a rider, but still, the modern aero bike required [...] a staggering 52 fewer watts at 50 km/h [31.1 mph]."[whwrg]
This statement and the tests were intended to highlight the improvements made in aerodynamics over the past 30-plus years. A 52-watt savings sounds pretty impressive. However, once the watts are calculated for real-world benefits, as shown in the Only 3 Watts figure above, the savings fall to around 3 watts, at best.
Full aero bikes have about 0.05 mph speed benefit compared to contemporary non-aero bikes, maybe
Bringing the above wind tunnel tests into this decade, the watt gains are significantly lower than a race bike from 30 years ago. For example, a current Seven with disc brakes and wireless shifting, and approximately 40 mm deep carbon rims (the Cervelo had deep-dish wheels), cuts the advantage of a modern full aero bike by about 50%.[12wtb] This results in only a 1.7-watt improvement (about 50% of 3.3 watts). This provides a drag reduction of about 0.05 mph improvement on paper. However, that slight benefit is quickly overshadowed by a long list of performance issues that slow down aero bikes, including harsher ride quality, sucking up rider energy and reserves, and being harder to handle.
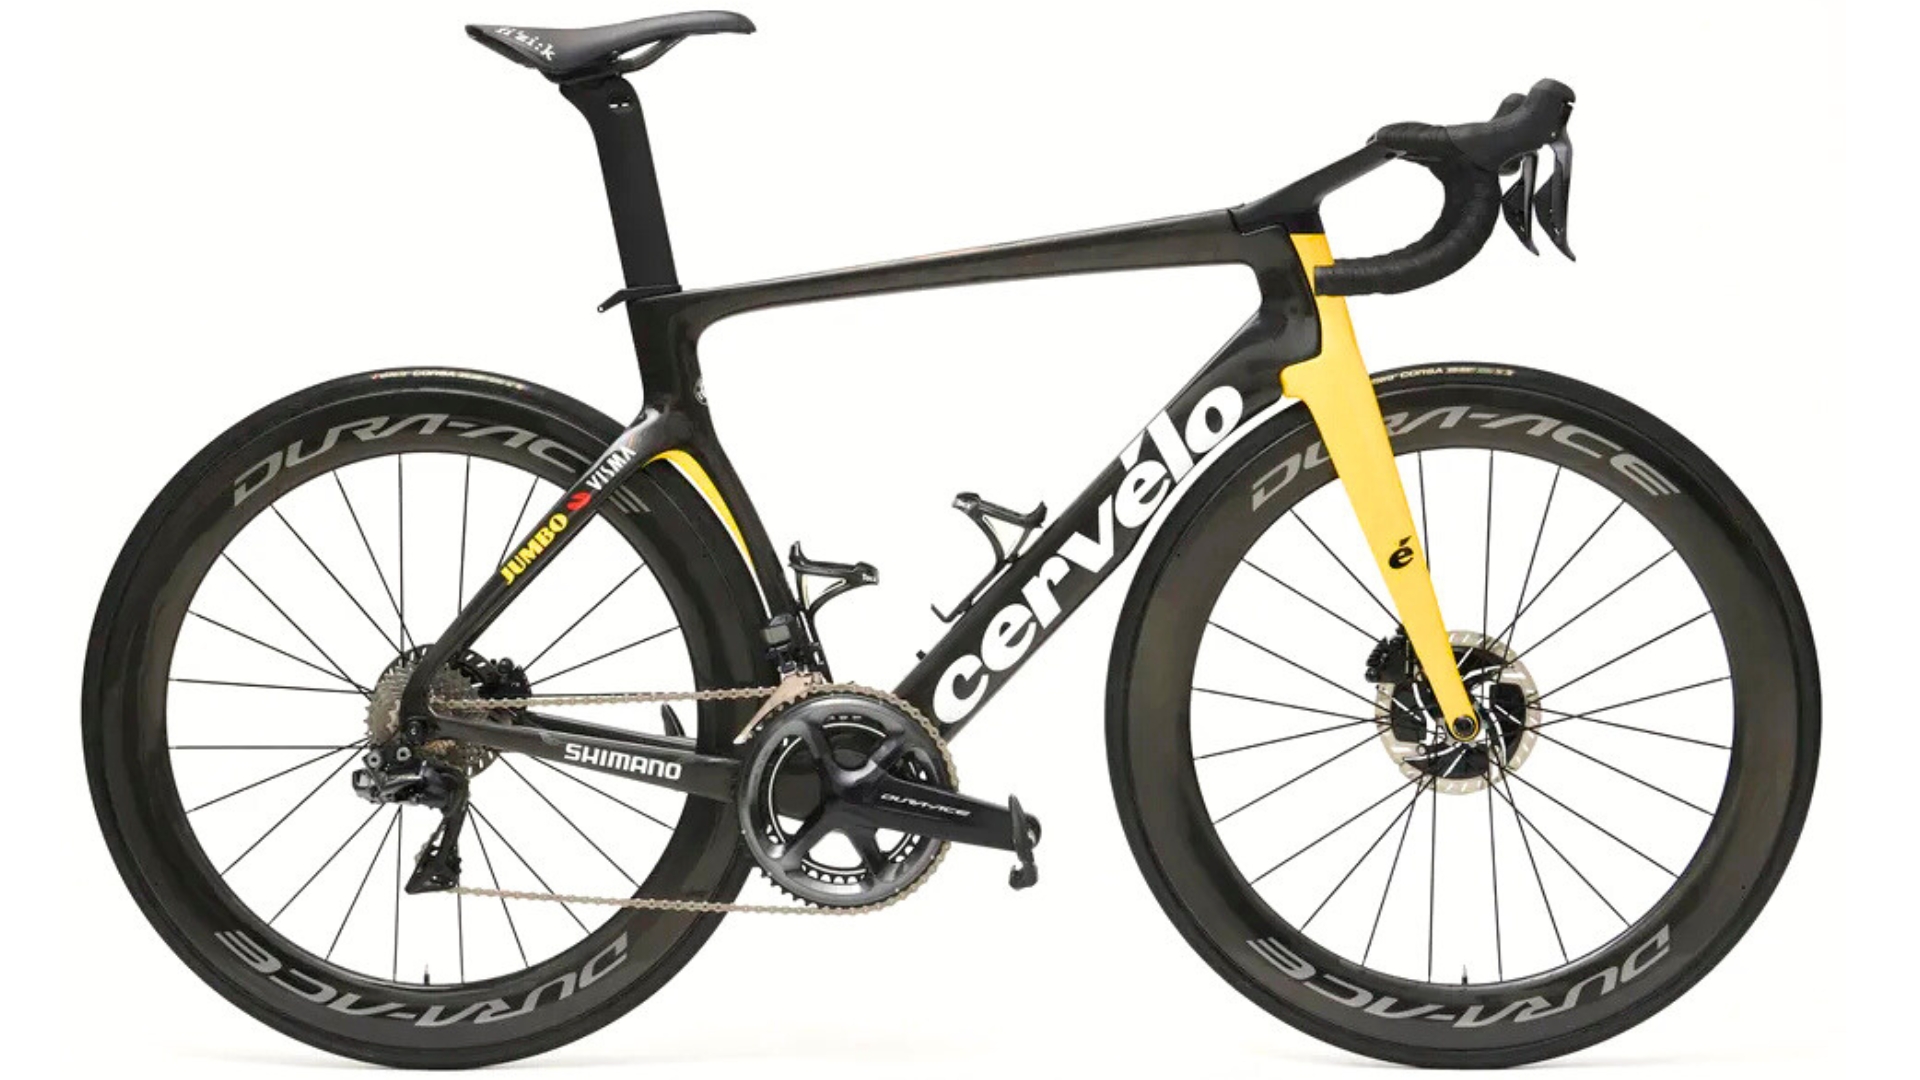
Note: Cervelo makes good bikes. The S5 is one of the most aero available. We use this reference simply because it's the bike referred to in Outside (Velo) magazine.[whwrg2] Many aero bikes provide similar wind tunnel watt savings, so the data are easily be extrapolated for any aero bike with the same disappointing results.
World Champion Time Trialists Don't Benefit from Bike Frame Aerodynamics
The Time Trial Speed figure below illustrates the difficulty in finding any measurable benefit from bike tech or aerodynamic improvements. The winning time of the world championship individual time trial increases by about 0.04 mph annually. This is a speed trend line increase of about 0.1% per year. Conversely, the distance trend line is shorter by about 0.3% annually, thereby helping increase speed. Two dozen other factors should be increasing time-trial speeds (more aero riding positions, more aero wheels, improved road, improved training, better nutrition management, etc., as enumerated in the So Many Improvements, So Little Improvement figure in our Aerodynamic Frame Design article). Where are those gains?

For more details, footnotes, and references, read our article, "Aerodynamic Frame Design."
Aerodynamics Show No Value in the Tour de France (Or Any Road Race)
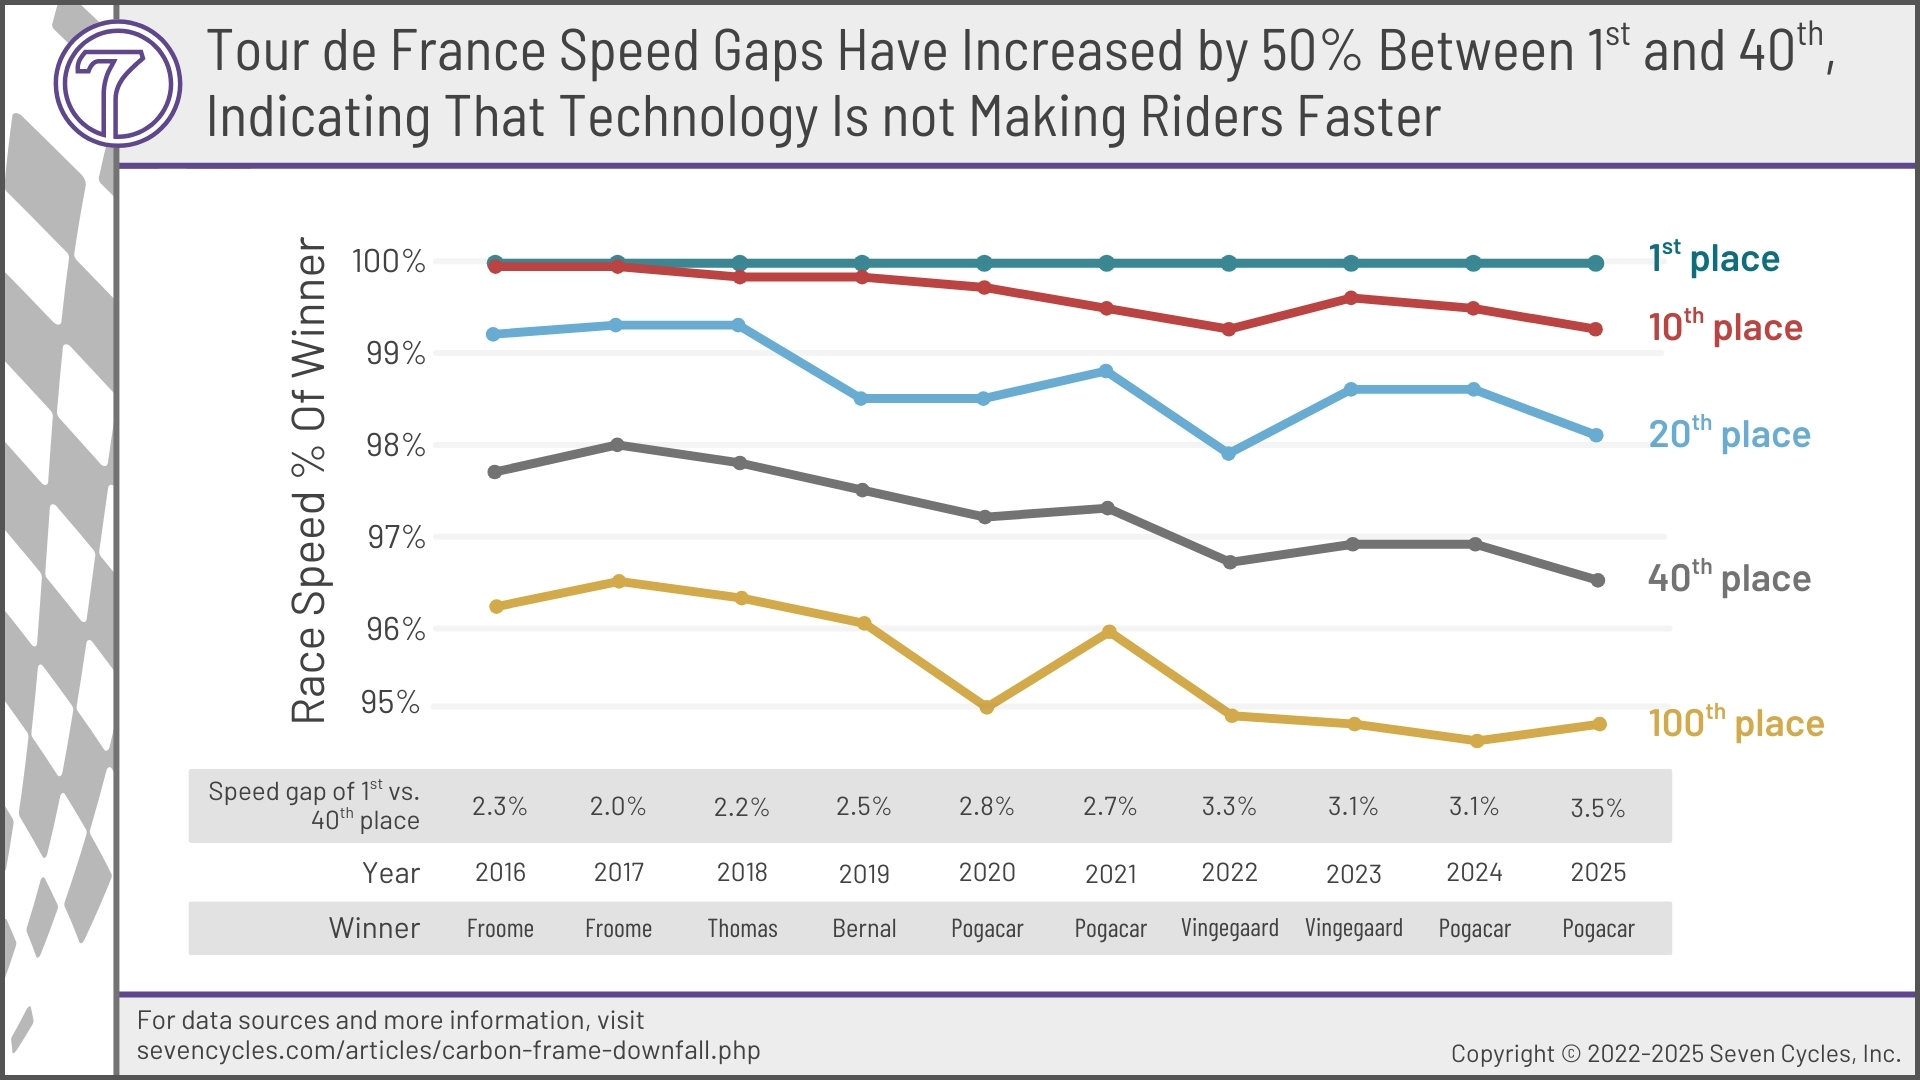
Race winners are outliers. Mortals hold them on high to represent the best of sport and to showcase technological progress. The problem is that they are, by definition, exceptional. They skew speed and performance data year over year. To ensure we're not seeing individual exceptionalism, Seven compares winners to selections of the top 100 finishers in World Tour races.
When measuring the average speed of the 10th, 20th, 40th, and even 100th placed riders in the TdF, as shown in the TdF Speed Divergence figure below, the lack of speed improvements due to supposed annual aerodynamic gains becomes clear. If aero improvement played a role, all riders would be converging on the first-placed rider, as the Aerodynamics Squared Vs. Cubed sidebar explains. A 10-watt gain at 40 km/h increases speed benefit significantly more efficiently than 10 watts added at 44 km/h. Do this year after year, and the slower riders' speeds will show an annual marginal narrowing of the speed gap to faster riders.
Aerodynamics Squared Vs. Cubed:
Faster Riders Gain Less Speed
Doubling your speed requires approximately eight times the power.
"Force is proportional to the velocity (squared), but drag is proportional to velocity (cubed). Power = Force x Speed. So the drag FORCE is a squared term, but the POWER requirement to overcome that force and maintain a speed (velocity) is a cubed term."[bdaa] (paraphrased)
Force = 1/2 air density * drag coefficient * frontal area * velocity squared
Power = 1/2 air density * drag coefficient * frontal area * velocity cubed
Despite aero promises, every rider is getting slower and slower relative to the winners. Even if podium placers are considered freaks of nature, the 10th-placed rider, the 20th-placed rider are all losing ground on each other. The lower the place, the wider the divergence. Aerodynamics are not aeroing.
Aero Frames Ride Harsh
Aero shapes are longer than they are wide, as illustrated in the Aero Is Harsh figure below. The tube's length results in fore-aft and vertical harshness. The width of the tube provides lateral stiffness (for the drivetrain).
Some may say, "Who cares if the frame is a bit harsh? It's faster, and that's a good tradeoff." Data shows that this isn't the case. The 1-2 watts gained from drag improvement is more than offset by the speed decline due to increased harshness, resulting in worse handling, recovery, and control.
A round tube is tough to beat for lateral and torsional stiffness, as is critical in performance bikes.
★ Seven's Aerodynamic Differentiation ★
Rather than offer aesthetically aerodynamic bikes, Seven offers performance-optimized bikes.
Real-world speed increases come from better power transfer, which carbon does not match, and better handling, which carbon foregoes in its pursuit of aero adventures. As illustrated in the Aero Is Harsh figure above, aerodynamic tube shapes work against the goals of drivetrain stiffness and a smooth ride.
Also unachievable with aero carbon is Seven's faster recovery and sensory feedback for more speed and control.★
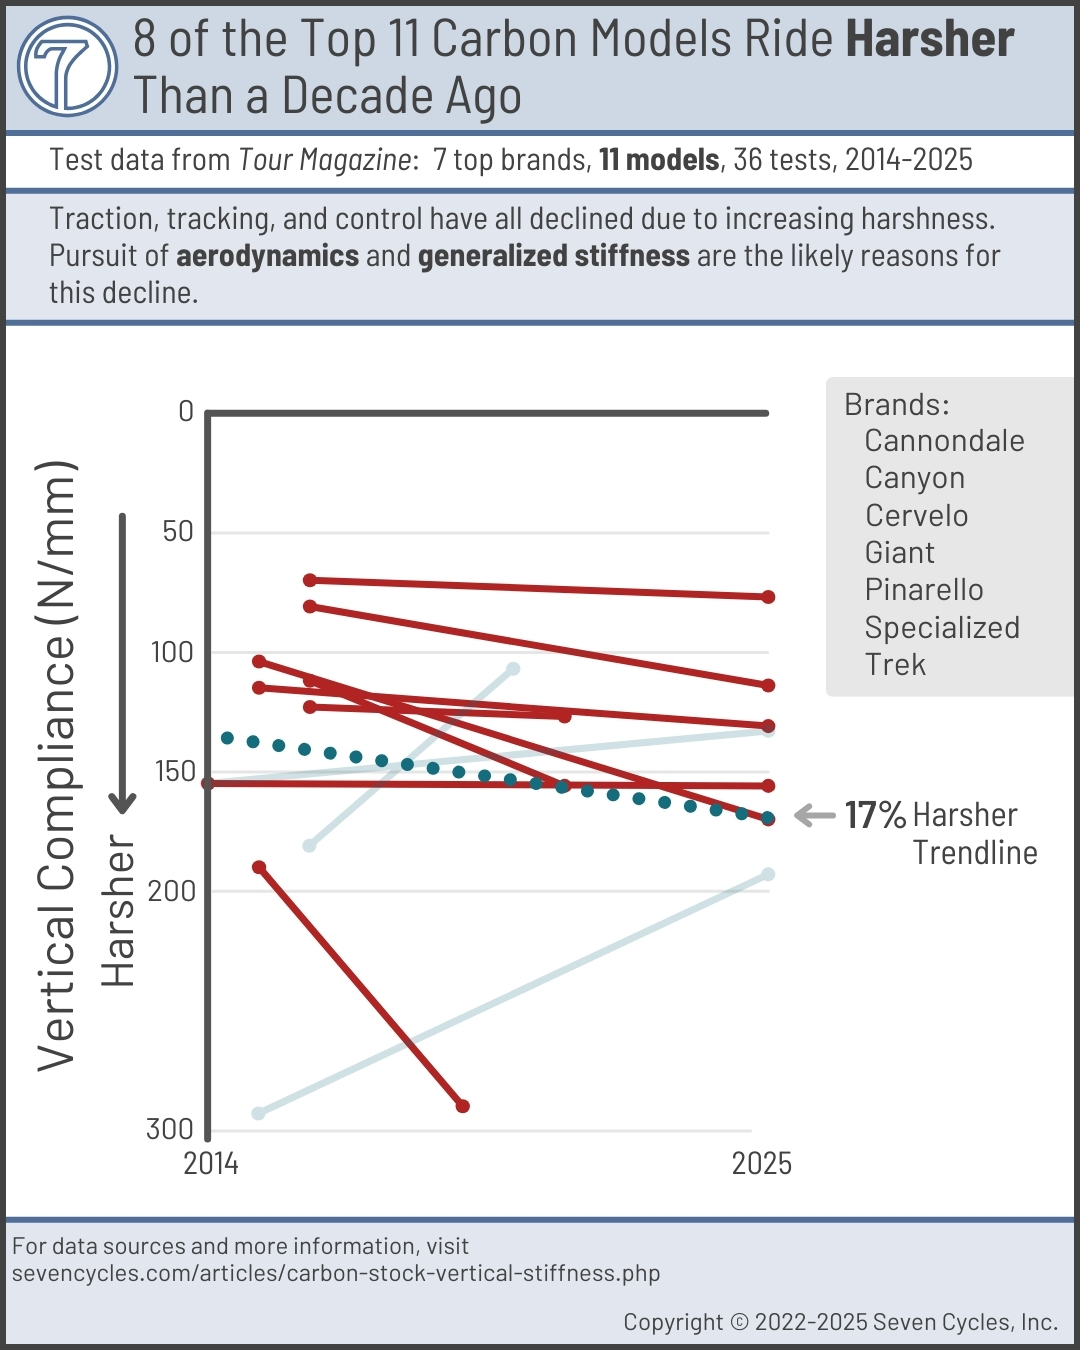
Harsh Rides That Get Harsher Every Year
A harsh ride is a challenging ride. Challenging to control and handle. Challenging for rider recovery. Challenging to achieve maximum sustained speed.
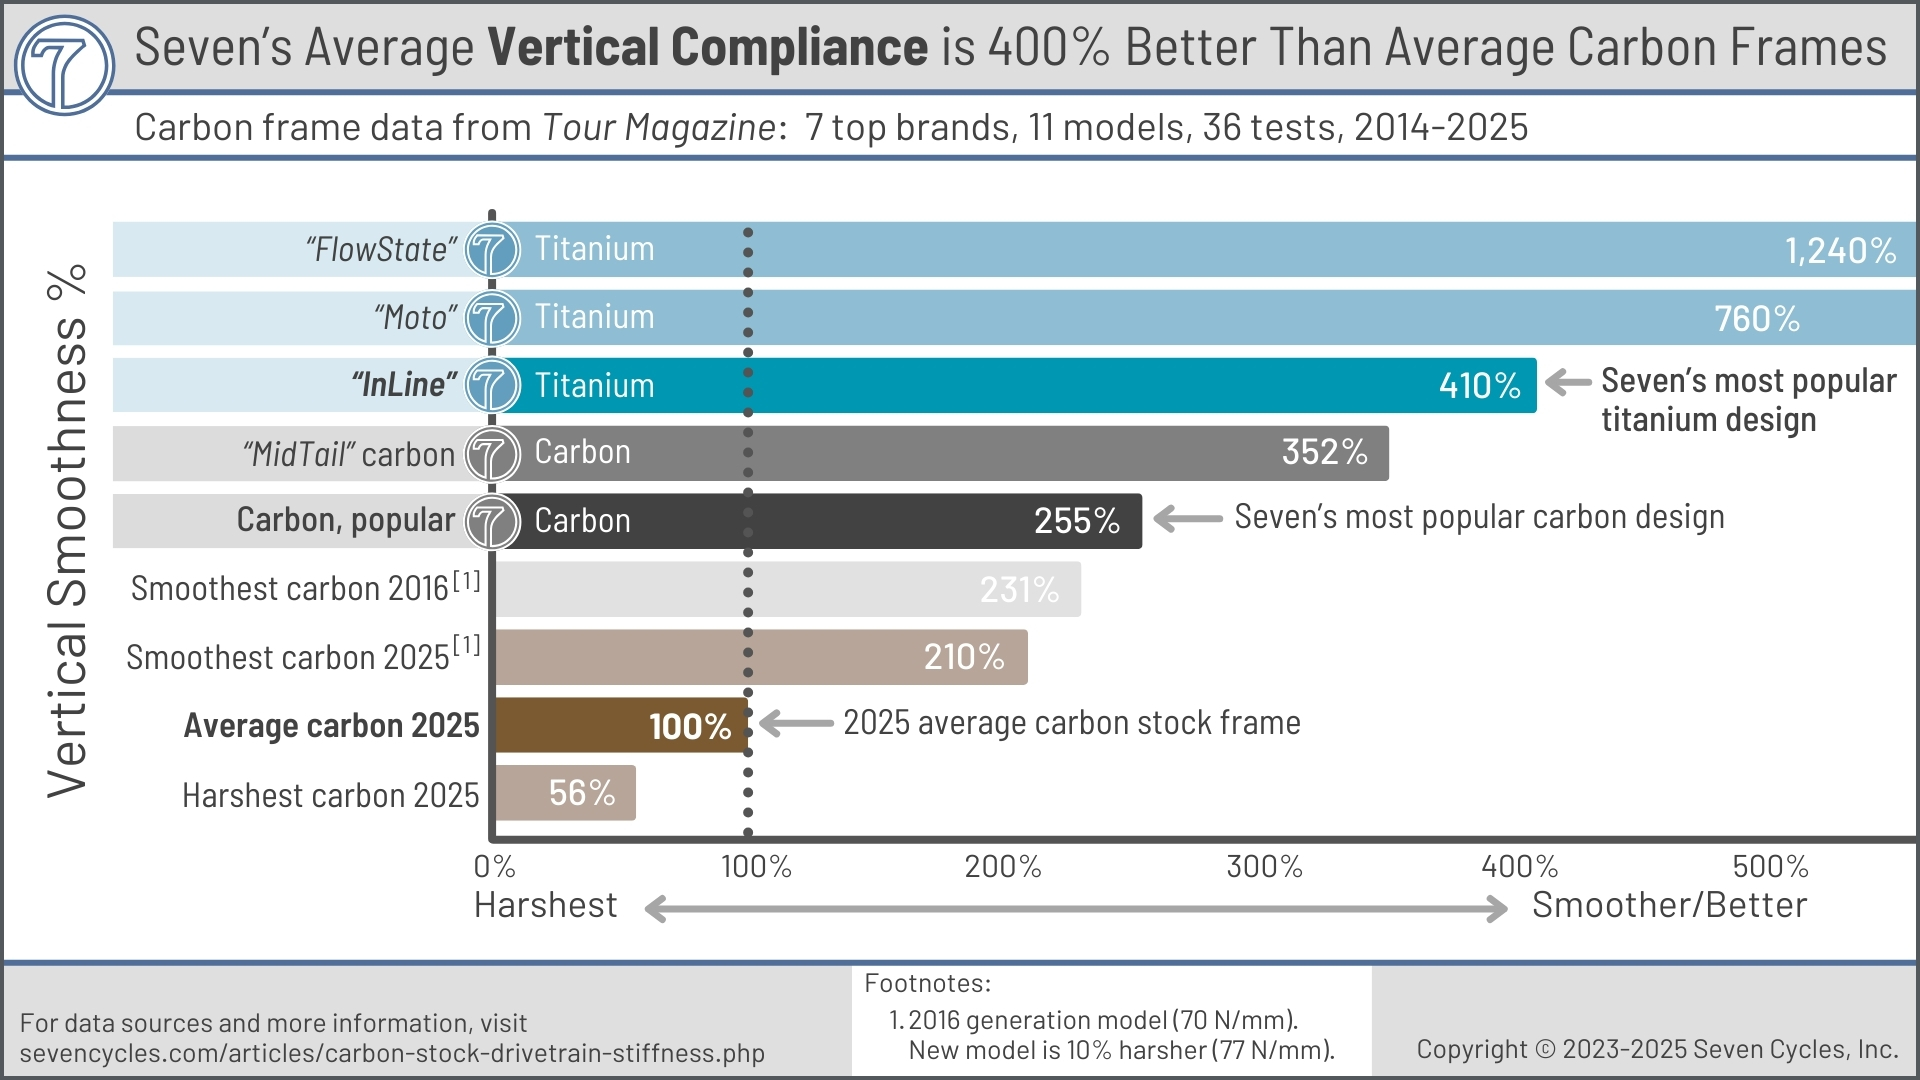
Aero-shaped carbon frames ride harsher. Carbon designs are riding harsher and harsher with each generation (Figure, Harsher Every Year). The lightest carbon frames still transfer 200% more road and trail vibration than Seven's average titanium frame design (Figure Seven is 400% Smoother).
Harshness arises from vertical and fore-aft stiffness. This results in terrain vibrations traveling through the bike to the rider.
The Harsher Every Year figure illustrates the decline in smooth-riding carbon bikes over the past decade for the majority of performance offerings.
For the rider, there's no upside to a harsher frame but plenty of downsides: poor control, handling, and recovery time are a few of the issues. However, for carbon frame designers, increasing harshness is a requirement to offset two of carbon's primary shortcomings: stiffness degradation over time and frame fragility.
★ Seven's Different Approach to Managing Vibration and Harshness ★
In 1988, Seven's lead engineer developed the idea of "vertical compliance," or Frame FlowTM, as a competitive riding advantage. Today, it's one of the reasons Sevens ride so well. The key to this is tuning the frame's flow to the rider and riding situation.
Our Rider-Ready bikes are good examples of optimizing Frame Flow. Everything is predicated on specificity. Specificity of sizing (24 to 36 of them), specificity of usage (for example, 12 gravel models and categories), and specificity of weight (tubesets tailored for rider and cargo combined).
Numerous engineering factors go into the design of a frame for vibration damping and shock absorption. By far the most important (in Seven's view) is the seat stay system. This includes the seat stays, dropouts, and seat tube. ★
Bike Harshness Dampens Beneficial Sensory Feedback
Achieving a balanced road feel, or terrain feel, is a crucial engineering strategy for achieving high performance. This sensory feedback attribute is often misunderstood or ignored during frame design and tubeset selection (or carbon laminate layup).
A good metal bike can provide a valuable, subtle road-surface sensation; carbon cannot. Road feel can give significant speed by keeping the wheels planted on the ground. The more attuned the terrain feedback, the more surefooted the rider, and the faster the ride.
Signal or Noise?
Road feel is sometimes confused with vibration, harshness, or generalized frame stiffness. The thinking is that more vibration means more road feel, but that's not correct. The rider experiences the road's imperfections (noise), but lacks a sense of the situation on the ground — like tire traction or contact patch behavior (signal).
Terrain/road feel comes from the wheels tracking and undulating with the surface — what Seven calls Frame Flow. This sensory feedback is most important at the edges of control; the moment before a tire loses traction, thereby allowing the rider time to correct and maintain control. (Rather than carbon's bone-shaking distraction that masks the rider's feel for the terrain).
Sensory feedback enables controlled scrubbing of speed through off-camber corners. (Rather than carbon's unforgiving shuddering as it repeatedly tries and fails to correct for the terrain).
Sensory feedback enables nuanced brake feathering on a dusty descent, preventing the tire from sliding while maintaining control of speed. (Rather than skittering down the hill on locked-up brakes and a prayer).
Precise sensory feedback communicates the tires' stickiness and grip limits before it's too late. (Whereas carbon bikes in the World Tour appear to lay riders on the deck without warning.)
★ Seven's Unique Sensory Feedback Approach to Bike Design ★
More signal, less noise.
Seven leverages titanium's high fatigue life to accentuate Frame Flow and a smooth ride that prioritizes performance. Tuning sensory feedback results in more speed through better bike control and more effective on-bike recovery time. ★
Bike Harshness Causes Three Issues With Rider Recovery
- Harshness obstructs On-Bike Recovery
- Harshness reduces Sustained Workload Capacity
- Harshness impedes Post-Rider Recovery
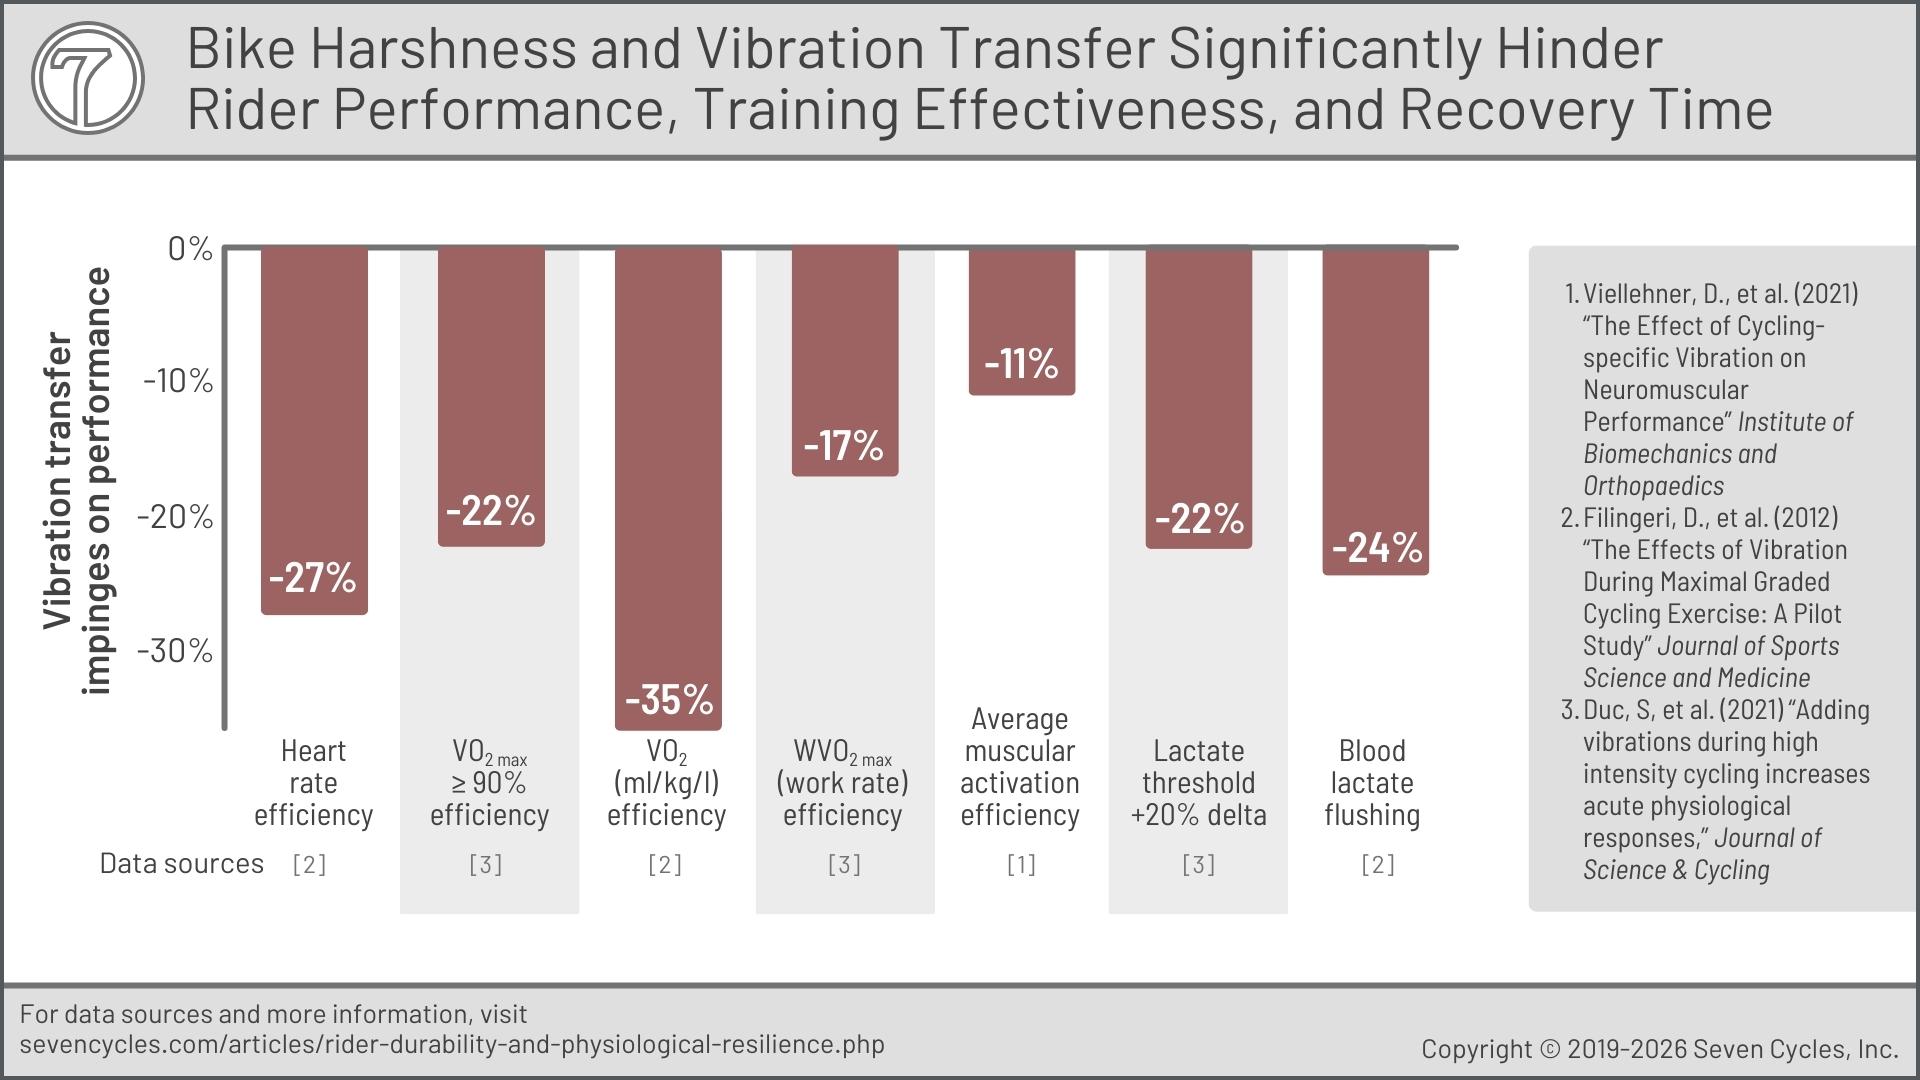
The Poor Recovery figure below illustrates examples of vibration's impact on performance. While the figure is an oversimplification, all the research into the effects of vibration during exercise shows measurable performance degradation. The harsher the bike's ride, the more intense and damaging the vibration. Harshness comes from tube stiffness. Carbon frames must be stiffer than optimal in the vertical plane.
Bike Harshness Obstructs On-Bike Recovery
Heart rate "was significantly higher during the [...] vibration trial compared to the no vibration." Blood lactate "concentration was significantly higher during the vibration trial."[evdmga] Emphasis added.
Recovery effectiveness after repeated intense efforts (sprinting, climbing, accelerating) is, for many riders, a fundamental aspect of training for improvement. The more road or trail vibration that's transferred through the bike to the rider, the less effective and more fatiguing the effort.
Recover from the Effort or Recover from the Bike?
Any energy spent bracing for or managing vibration is energy wasted. As the Poor Recovery figure above illustrates, vibration reduces performance and slows rider recovery. For example, heart rate and blood lactate are significantly higher.[evdmgb] This means recuperation from each effort is compromised, and therefore, the intended gains are diminished.
Bike Vibration Reduces Sustained Workload Capacity
"An increase in local muscular activation [10.9%], which consequently increases the systemic energy demand, potentially impairs performance in cycling." (Viellehner et al. 2021) Emphasis added.
"A significantly higher VO2 was measured during the [...] vibration trial compared to no vibration."[evdmgc] Emphasis added.
Vibration Costs Performance & Speed
Sustained efforts and average speeds are lower when energy is diverted to combat vibration fatigue. The rider is deeper in their VO2 and activates more muscles. Every ride is more exhausting.
As the Poor Recovery figure shows above, vibration costs sustained performance. VO2 is significantly higher (Duc et al. 2021),[evdmgd] and muscular activation (Viellehner et al. 2021) is elevated.
Bike vibration affects rider performance in real time. Not just with hand numbness, saddle discomfort, and foot pain. Those are outward signs of bigger issues that very often have vibration transfer at their core. These warnings are caused by the rider working to micromanage the bike and body: bracing for micro-impacts, maintaining a tight, constrained stance on the bike to manage reverberation, and applying more effort to control, counteract, and redirect the bike. These all exhaust the rider, whether or not it's apparent.
A Harsh Riding Bike Impedes Post-Ride Recovery
"The maximal [blood] lactate concentration measured at the end of each trial was found significantly higher after the vibration trial (14.05 mmol·l-1) compared to no vibration (11.31 mmol·l-1)." A 24% difference. (Duc et al. 2021) Emphasis added.
Blood lactate "concentration was significantly higher during the vibration trial compared to the no vibration trial."[evdmge] Emphasis added.
As the Poor Recovery figure above illustrates, most on-bike issues persist off the bike. Of course, blood lactate is a primary hindrance to off-bike recovery. Blood lactate is higher (Duc et al. 2021) and stays more concentrated[evdmgf] due to bike vibration transfer.
★ Seven's Rider Recovery Differentiation ★
Seven's testing shows that vertical compliance or flow is the most underrated frame performance benefit. Rider recovery is one reason, but others include bike control and handling surefootedness and sensory rider feedback.
Modern carbon framesets crush all of these substantial benefits. The lightest carbon frames still transfer 200% more vibration to the rider than Seven's average titanium tubeset design. (Seven is 4x Smoother figure) ★
Faster Racing Is Not Due to Bike Technology
To the extent bike racing is getting faster, the overwhelming reasons are 1) races are getting shorter (reference route distance data), 2) bike climbs are fewer, 3) training methods and nutrition have improved (reference calorie intake), and roads are getting smoother and more consistent.
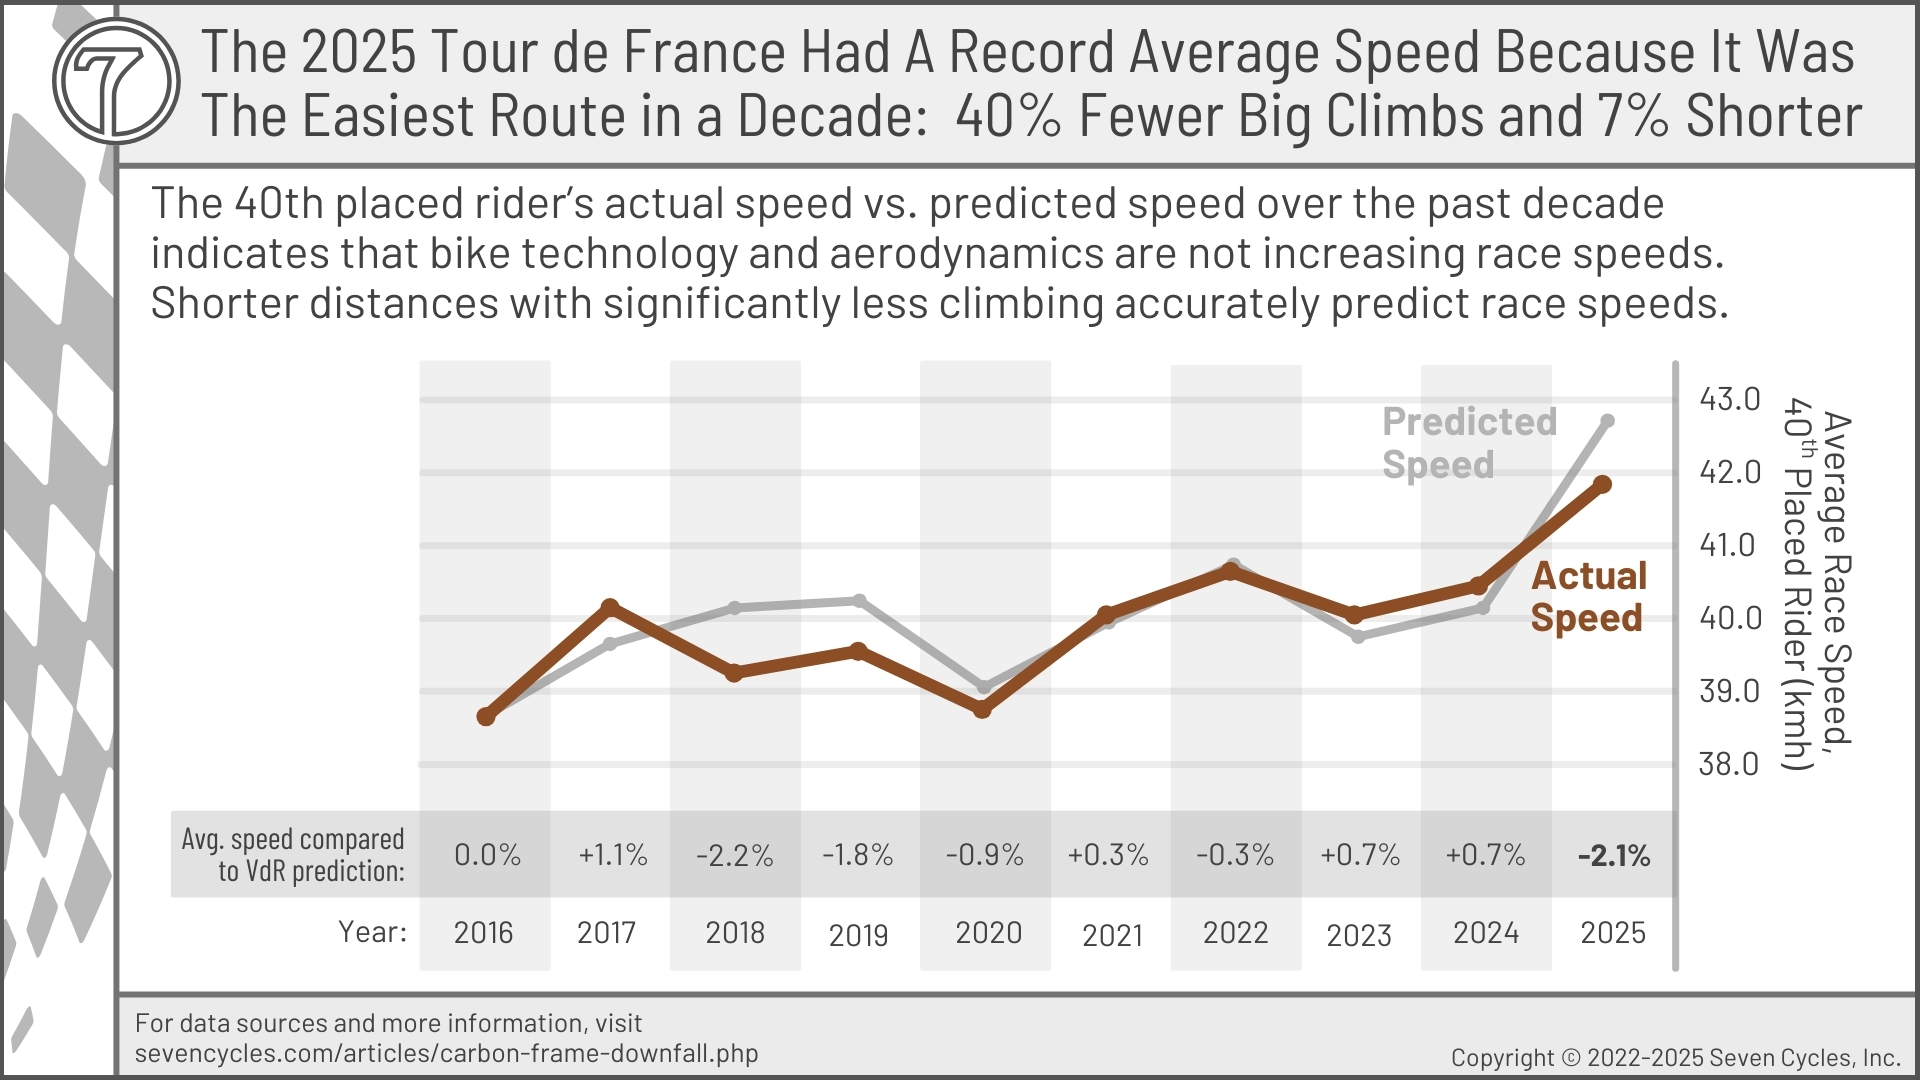
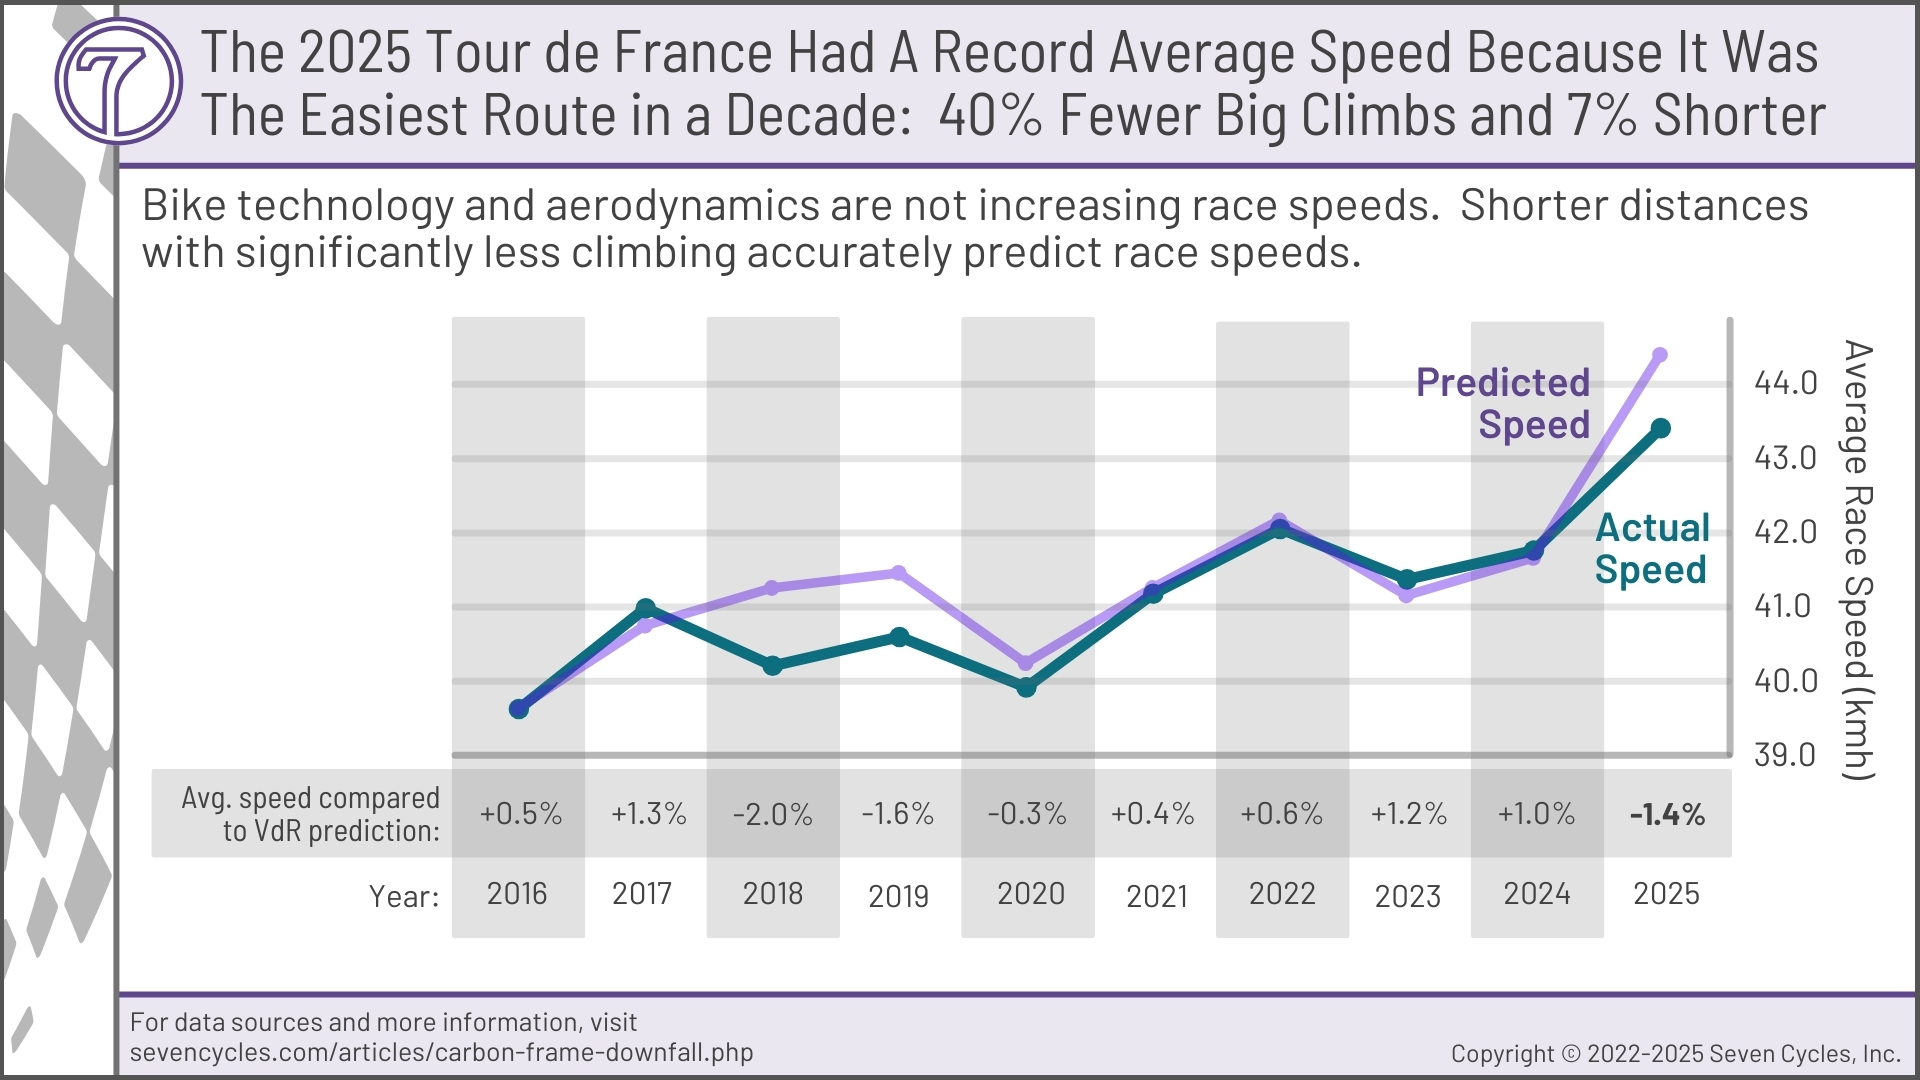
The 2025 Tour de France (TdF) is a good example of confusion between speed from tech and speed from easier routes. The TdF 2025 was the fastest ever in large part because it had 38% fewer category 1 and HC climbs and 6% fewer kilometers than a decade ago (reference route distance data). Increased speed is a predictable result.
The Only 3 Watts figure above illustrates the lack of aerodynamic benefits. The technology options that remain to increase speed include more efficient (stiffer?) frames, wider tires, lower, higher, and wider gearing, disc brakes, shorter cranks, and more. Regardless, time gains are missing from race results.
The Speed Prediction 40th Place figure illustrates the banality of Tour de France race speeds. Seven's VdM Speed Predictor has been accurate to within 2% (0.8 kmh) for the past decade.[vdm] Equally important, the VdM speed change direction (faster or slower) prediction has been accurate in 8 of the 9 successive races. (It's 9 years rather than 10 because the first year, 2016, is the baseline.) Seven predicted the 2025 TdF would be the fastest yet — at 44.2 km/h. The prediction was 1.4% faster than the final average speed. In other words, the Tour was a bit slow this year.
Bike technology is not helping riders go faster; it's making riders slower
Divergence: Time Gaps Are Wider Than Ever
Pro peloton speeds between first and 10th place (and 10th and 20th, and 10th and 40th) are diverging, but if bike technology was making everyone faster, speed gaps would be converging. Technology speed gains provide a larger benefit to slower riders because anything that increases speed also increases aerodynamic drag at the second power, as the Technology Squared Vs. Cubed sidebar explains.
The faster you ride, the more difficult it is to improve on previous gains. Therefore, A slower rider (40th place) will, by definition, benefit more from each watt saved than a faster rider (say, 10th place). For example, 28 mm tires are a speed enhancer. A slower rider's speed improvement with wide tires will be greater than a faster rider's speed increase with the same tires. And yet, the data shows the opposite: slower riders are going relatively slower year after year, not faster.
Technology Squared Vs. Cubed:
Faster Riders Gain Less Speed
Doubling your speed requires approximately eight times the power.
"Force is proportional to the velocity (squared), but drag is proportional to velocity (cubed). Power = Force x Speed. So the drag FORCE is a squared term, but the POWER requirement to overcome that force and maintain a speed (velocity) is a cubed term."[bdab] (paraphrased)
Force = 1/2 air density * drag coefficient * frontal area * velocity squared
Power = 1/2 air density * drag coefficient * frontal area * velocity cubed
The fundamental question we ask is, "Why are all riders going slower and slower year after year compared to faster riders?" This is an even more compelling question when promised aerodynamic gains are included in the speed divergence. This is a challenging question to answer, but we hypothesize that declining bike handling performance and waning rider confidence are the primary causes.
The 40th vs. 10th Divergence figure below visualizes the growing gap between actual speeds and the calculated speed increases that should occur. This doesn't even take into account all of the non-aero tech improvements that occur (wider tires, disc brakes, narrow bars, carbon frames, lighter weight, etc.), which should be compounding the speed increases year after year.
Where is all the speed that marketing promised?

Carbon bikes are slower in relative terms (the 40th vs. 10th Divergence figure above) and in absolute terms (first half of 2025 vs. first half of 2024). Even with all of this speed restraint, crashes and injuries increase annually at alarming rates. The reasons for these issues are that carbon bikes are more challenging to handle and control, and are less confidence-inspiring. Handling is worse because frames ride harsher and aero tube shapes run counter to optimum handling, both of which impinge on tire traction and wreak havoc on wheel tracking and predictability. The feel of the road surface, which helps the rider judge traction and heighten situational awareness, is gone. A good metal bike provides traction feedback; carbon does not.
Racers Are Climbing Faster Than Ever
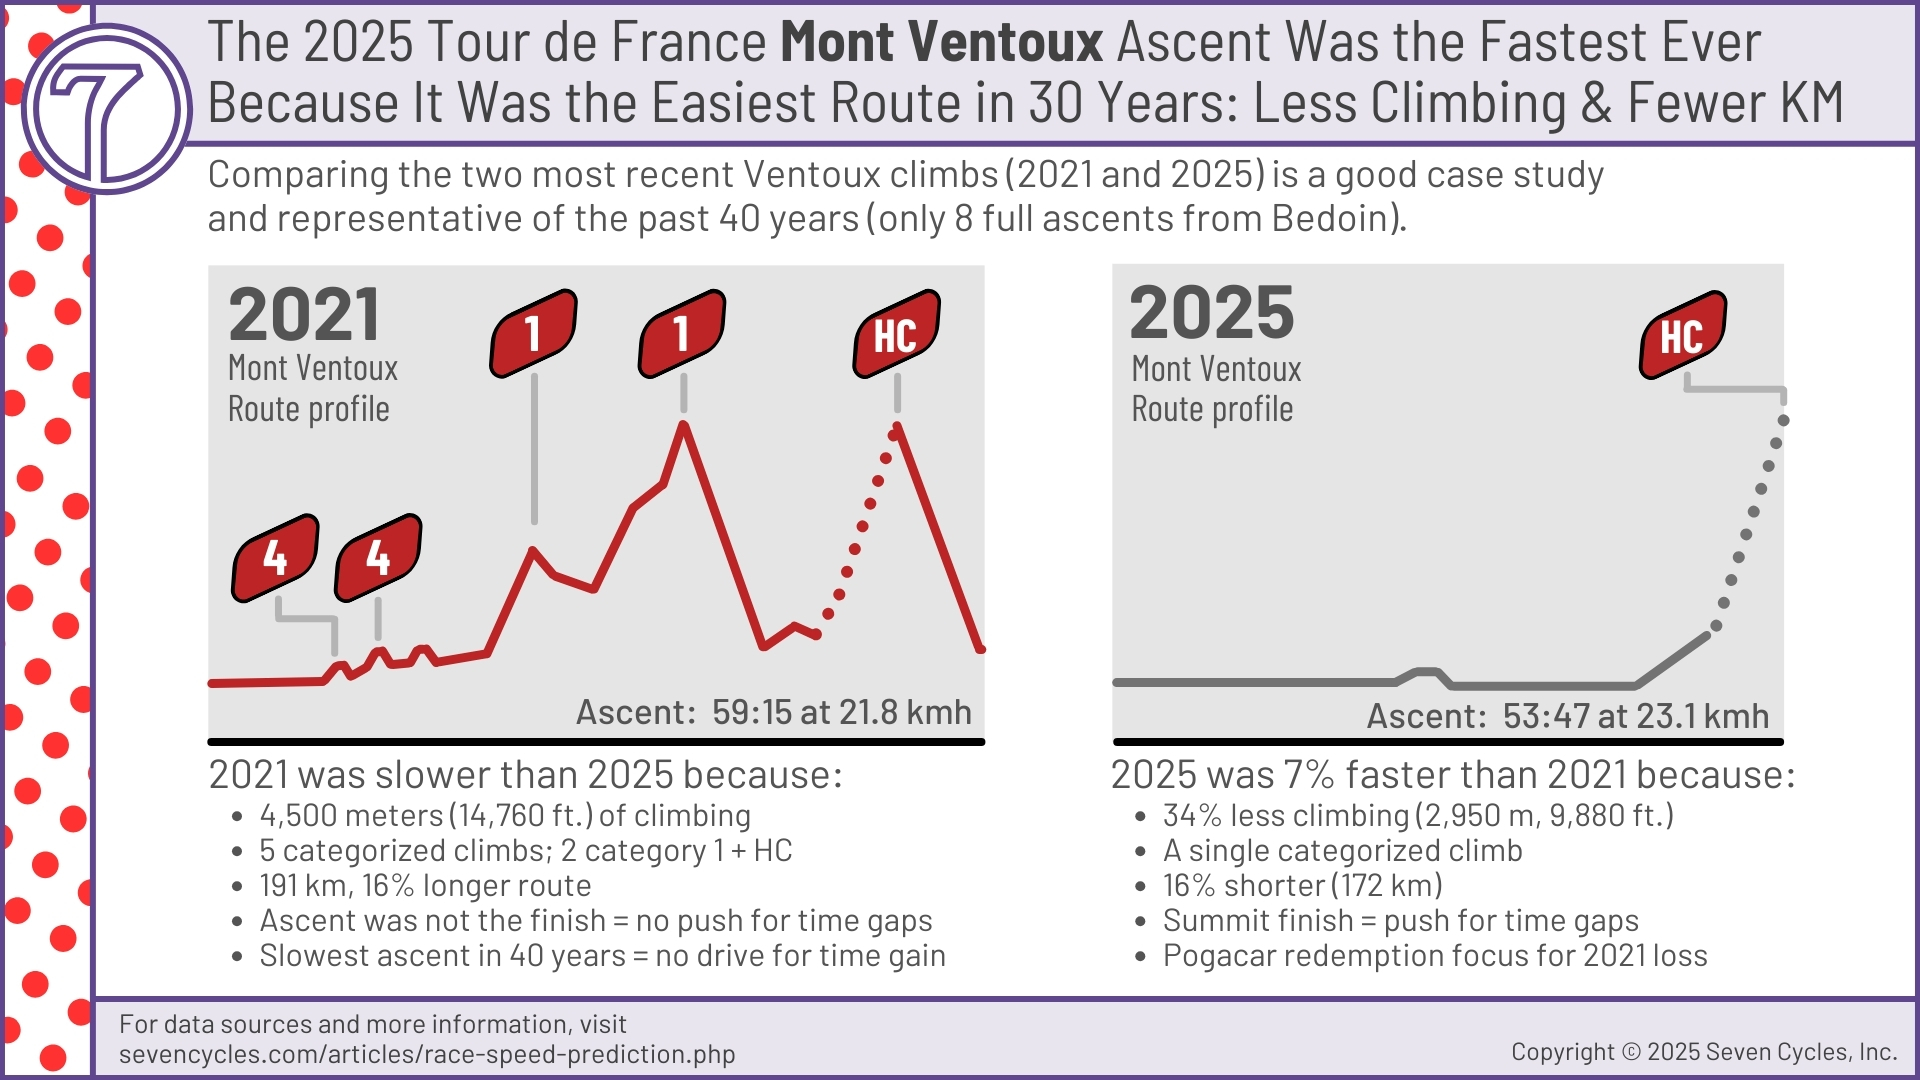
This is sometimes true. When it does occur, it's not usually because racers are faster; it's because the stages are easier. Using the Mont Ventoux climb in the 2025 Tour de France as an example, it was the quickest ascent of Ventoux ever. The media loves to crow about it as evidence of bike technology's (or doping's or nutrition's) giant leaps forward. Is this evidence of faster racers? Not in this case. The Ventoux Speeds figure illustrates the significant differences in route and profile between the 2021 and 2025 Ventoux stages. (2021 was the most recent TdF Ventoux climb before 2025.) It is difficult to find a starker difference than these two. In fact, every single Ventoux ascent, beginning in 1994 (the earliest we could find sufficient data), was more difficult than the 2025 running, with some combination of more climbing, more categorized climbs, longer distances, and worse road conditions.
Races Are Faster Than Ever
Race speeds are generally trending upward. This is true for every professional sport: marathon running, endurance swimming, cross-country skiing, etc. Therefore, an upward trend should occur for numerous reasons, with or without technological improvements.
The challenge with comparing most endurance sports to cycling is that other sports are usually based around a fixed distance. Cycling races change every year, so comparing one year to the next is difficult.
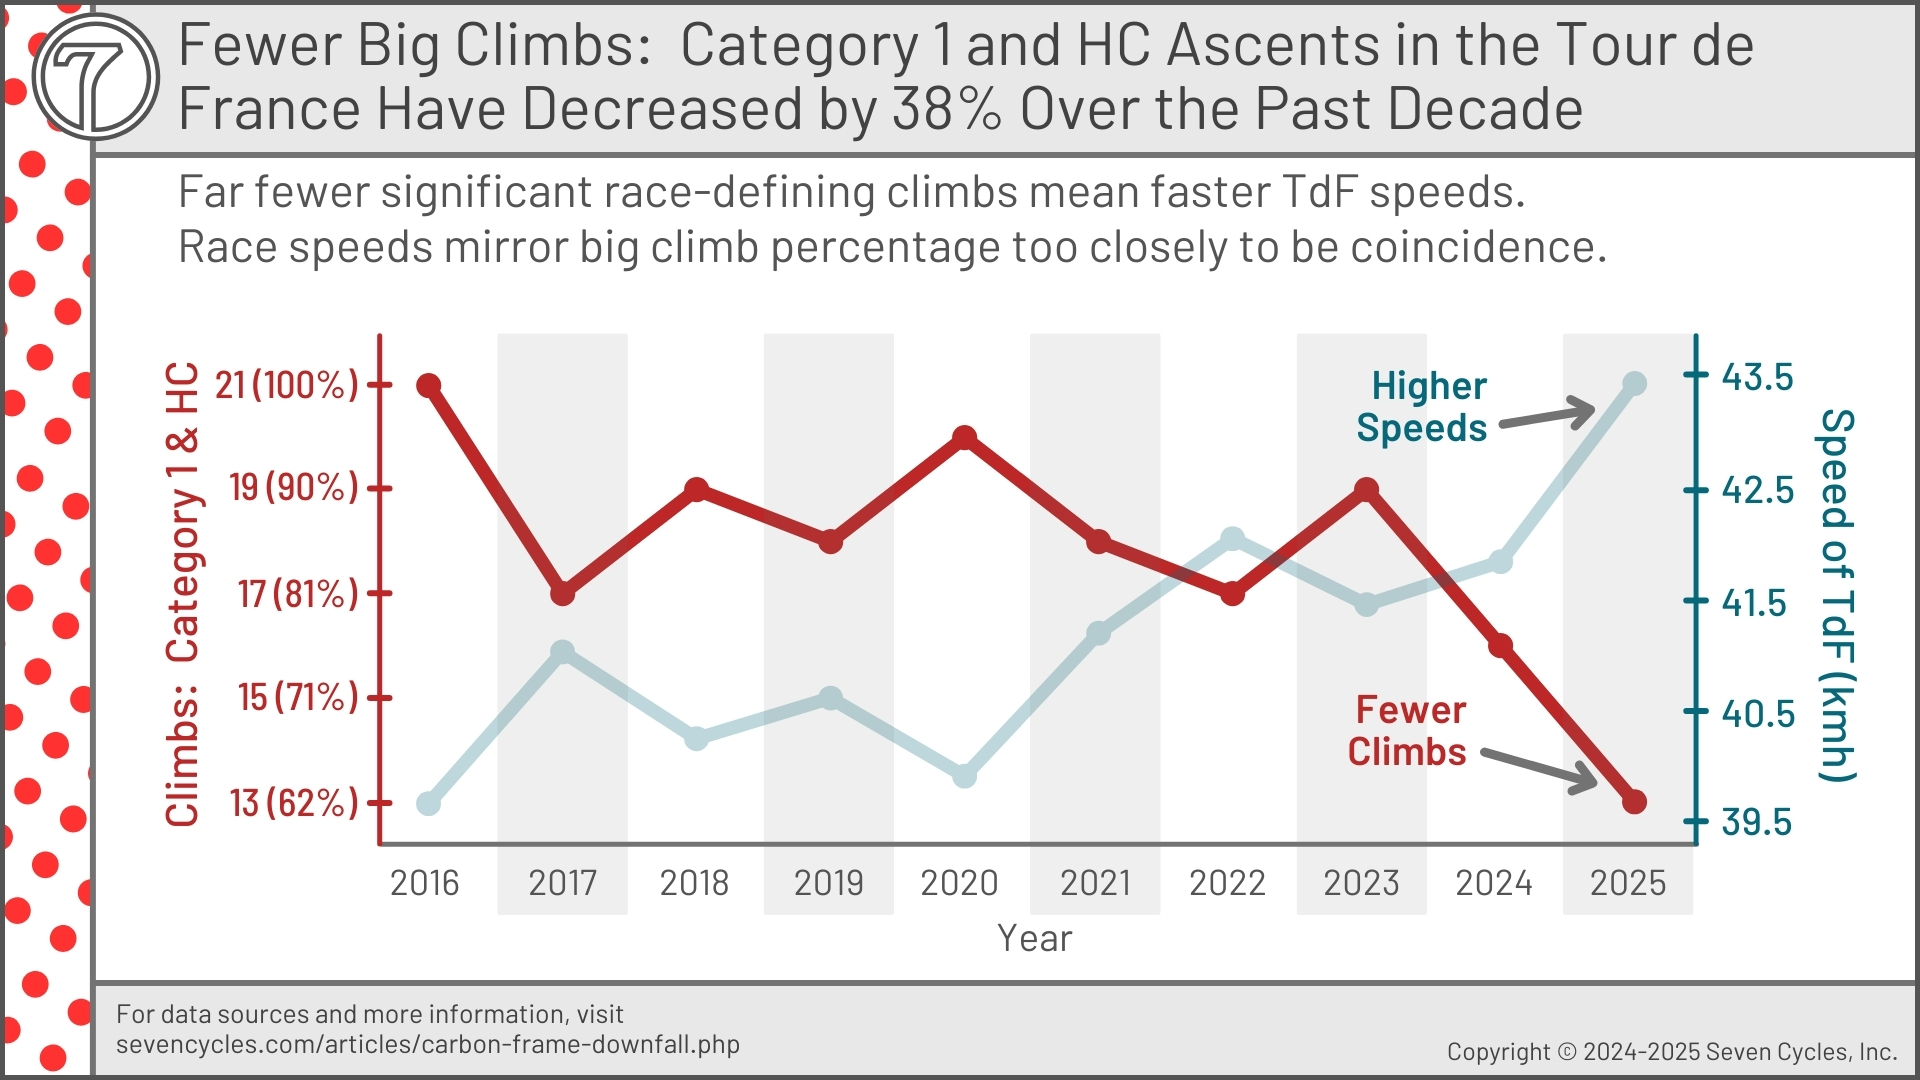
UCI World Tour races are shorter with fewer big climbs each year. Regardless, using the Tour de France as a case study, the "Less Climbing Means More Speed" figure below maps out speeds over the past decade and overlays each year's number of Category 1 and HC climbs. The annual speed changes track perfectly inverse to the number of big climbs.
★ Seven's Speed Differentiation ★
Seven's engineers focus on speed through control rather than speed through wind tunnels. The results are twofold. 1) We're not constrained by tech trends, lightweight, and tube shapes that all work against performance optimization. 2) We put all our effort into improving tangible performance rather than aero shapes with their associated issues. Tangible performance includes drivetrain stiffness, vertical flow, front-end control, sensory feedback optimization, frameset geometry, tubeset engineering, and rider integration.
★
World Tour race speeds are not easily compared year to year
People often think that Tour de France race times are comparable year over year, like a running marathon, or marathon swimming, or 50k cross-country skiing. When we examine a specific marathon, such as the Boston Marathon, for example, it's the same distance and route every year. The only variable is climate. If this year was faster than last year, the media can say that the winner ran faster and performed better. In World Tour road racing, every race in every year is different in distance, total climbing, and road quality compared to previous years. Even climate variation impacts speeds more in cycling than in running.
The Tour de France is a good example of meaningful variables that impact average speed and how the media perceive them. Most media seem to treat each World Tour race as if the course were identical each year, much like the Boston Marathon. If this year's average speed was faster than last year's, that means the winner was quicker and better. The Speed Prediction figure above illustrates how this line of reasoning leads to erroneous conclusions.
On one hand, who cares? On the other hand, millions of marketing dollars push the narrative that faster World Tour races are largely due to technology and aerodynamic advancements. That is demonstrably not true, and riders are paying for performance they are not receiving.
Read Seven's World Tour climbing speeds are not easily compared year to year in this white paper for more information.
Lighter Weight Means Fragile, Not Faster
Lightweight is one of the only functional attributes that carbon frames offer. Unfortunately, the lightest-weight frames, those generally under 1,100 grams (for gravel frames), offer negligible benefit and begin to hinder performance in material ways.
Meaningless because the lightest carbon frame provides only about a 0.4% lower weight than a typical Seven bike with rider and equipment. (See the maths of 0.4%.) About the weight of a smartphone.
Hindering performance because underweight carbon framesets handle poorly, are disposable by design, are more likely to cause crashes, fail on impact, and are more susceptible to failure by abrasion.
Riders and media focus on lightweight because it's easy to measure. Anyone with a scale can participate in that competition. If, instead, you'd rather compete with your friends or pro racers on the road and trails, day after day, chasing lighter weight, you'll end up with slower speeds and a worse riding experience.
Why Lighter Is Important
When discussing high-end bikes that are already in the lightest 1% of weight, the primary selling point of ever-lighter is that you'll climb faster. We've all read articles about minutes gained on ascents per kilogram shaved. Unfortunately, most pro peloton climbs are getting relatively slower year after year, regardless of rider or bike weight.
Climbs Are Slower
Speeds on important climbs in the Tour de France have trended slower over the past thirty years. The Climbs Are Slower figure illustrates this by using two famous and popular ascents: Alpe d'Huez and Col du Tourmalet (eastern ascent — the most popular direction).
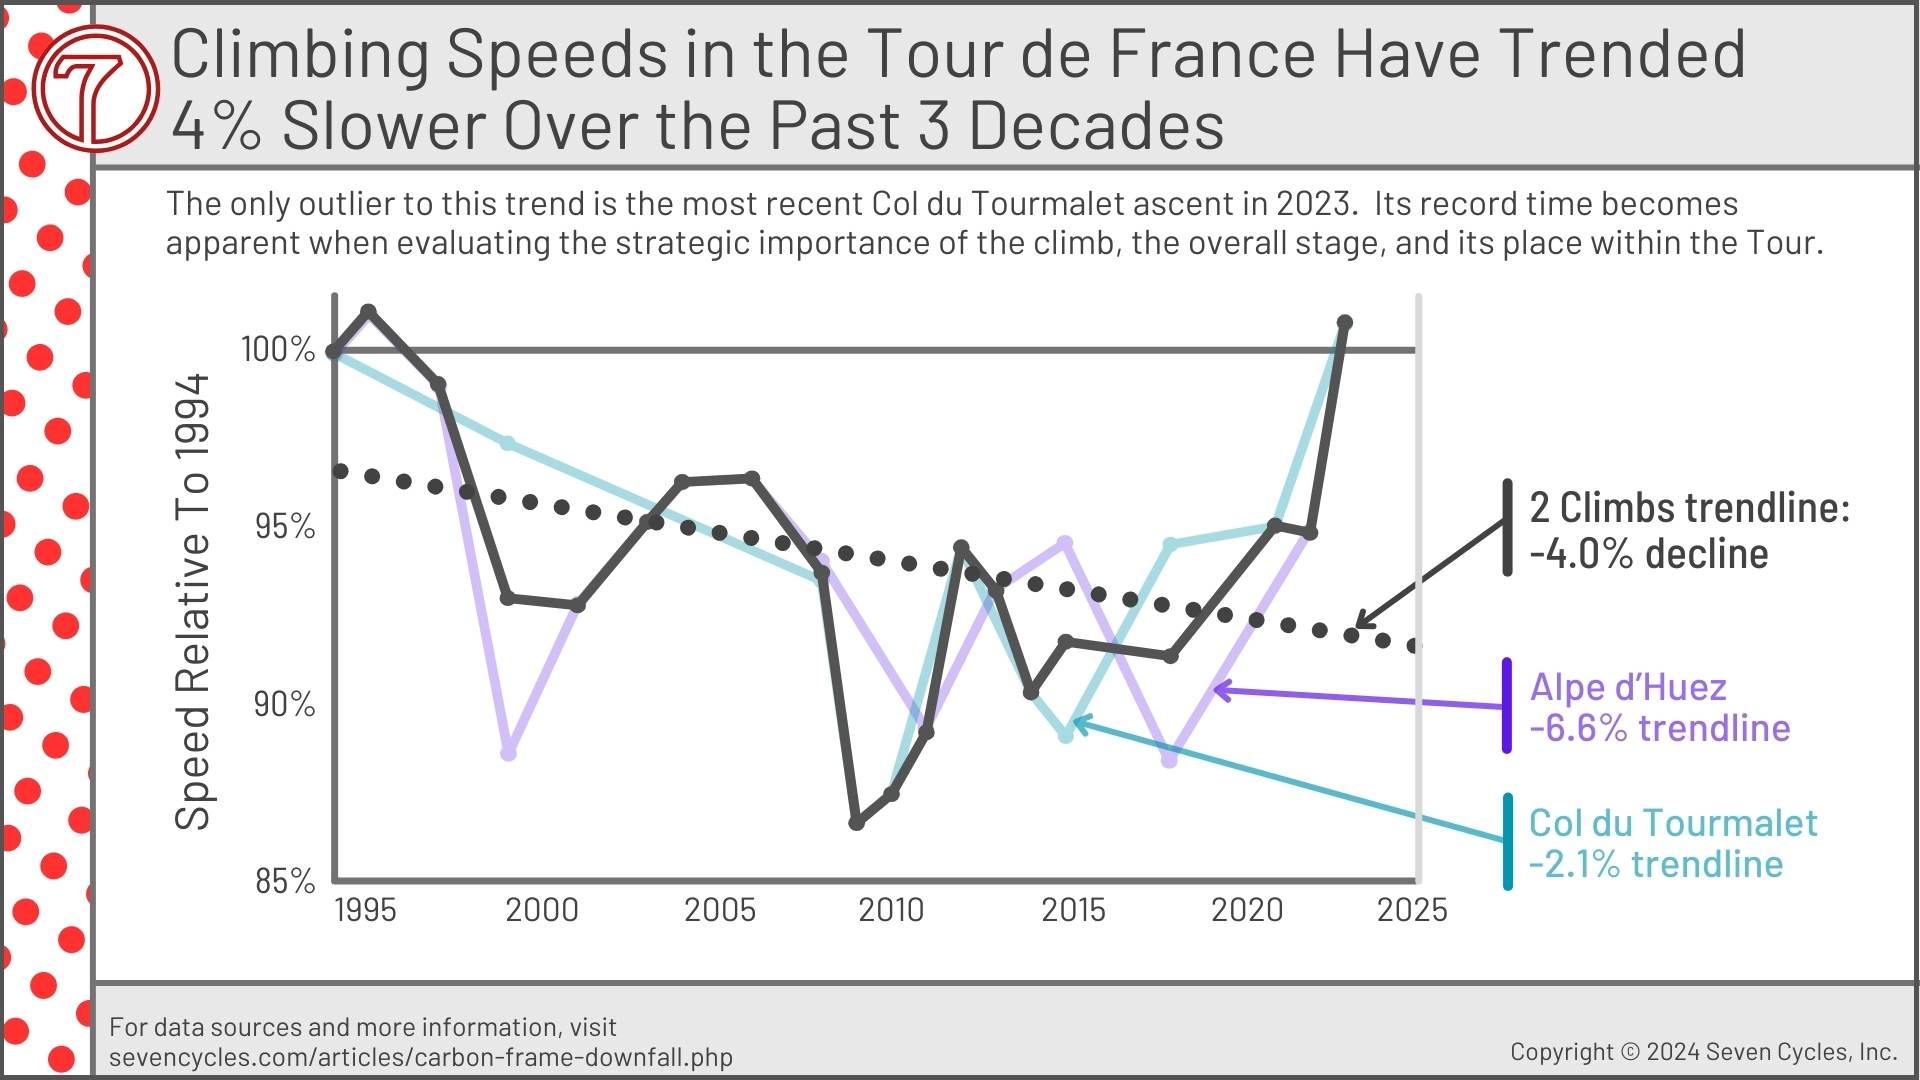
The exception to this downward speed trend, as shown in the Climbs Are Slower figure, is the 2023 Col du Tourmalet (CdT) ascent. It was the fastest in 30 years. It was also arguably the most likely CdT route to hit a record time. The reasons for this are nuanced and abundant, as the Tourmalet sidebar below enumerates.
The CdT ascent time comparison problem is similar to the Mont Ventoux Speed year-over-year comparison above, but more complex. The point is, it's difficult to compare the performance of a climb one year versus another without a broader context. Certainly, bike technology changes cannot be the only, or even primary, reason for sometimes improving segment times.
Sidebar: Col du Tourmalet: Which Year Is Most Impressive?
It's complicated.
The 2023 Tour de France ascent of the Tourmalet set a record time, and was considered a prototypical example of the benefits of ever-improving technology. Was it, though?
Of the most recent three eastbound ascents over the past decade, the most impressive climb, from a difficulty vs. ascent time perspective might be 2018. Or, more importantly, an argument can be made that 2023 was the easiest and most likely to be fastest for several reasons. We posit that none of the 2023 speed gains can be attributed improvements in bike technology.
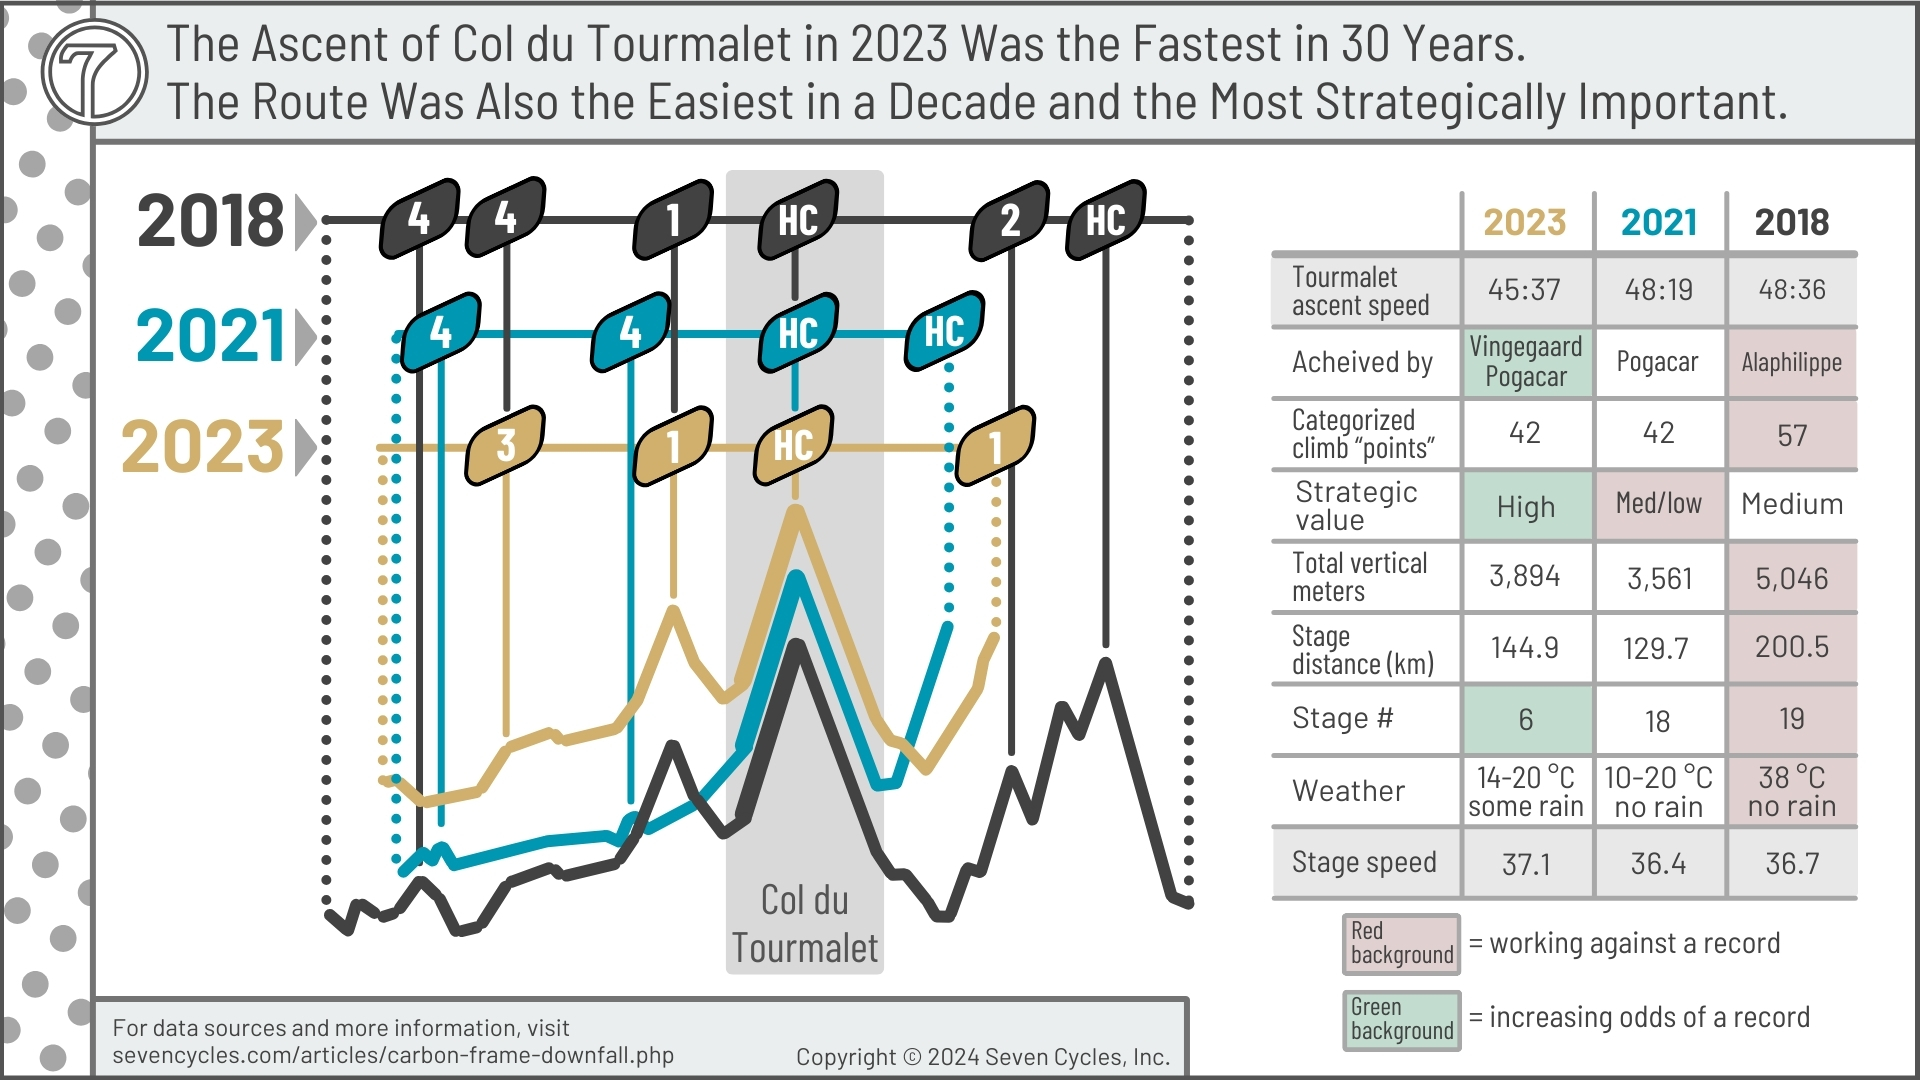
The Tourmalet Outlier figure above provides a good example of the difficulty in comparing a specific climb in one year vs. another.
One could argue the importance or triviality of each of the following factors. Still, at the very least, all stacked together, these elements create a blurred picture of technology's role in a faster or slower climb.
Strategic valueProbably the most critical factor affecting ascent speed, the strategic value of the climb in 2023 was very high. The Tourmalet would have been considered the decisive climb of the stage. GC contenders would focus on this. The 2021 Tourmalet was far less important because there was a second HC climb with no rest in between. While the first HC (the Tourmalet) could have been the decisive climb, the second one culminated at the finish and was therefore far more likely to be the deciding factor. The same holds true in 2018. The Tourmalet was about halfway through the stage with a lot of brutal climbing to come, so it's unlikely that anyone would go full gas and get close to a record.
The number of KOM points availableThe 2023 Tourmalet stage had 42 King of the Mountain (KOM) points on offer. Not bad, but the 2018 stage had 57 points available, a full 35% more. That includes two HC category climbs vs. one in 2023. (KOM points were tabulated using the TdF's standards: 20 for HC, 10 for cat 1, 5 for cat 2, 2 for cat 3, and 1 for cat 4.)
Stage numberBoth the 2018 and 2021 Toumalet stages occurred in the third week of the Tour. Everyone is breaking down and measuring efforts. The odds of a record occurring in the third week are lower than in the second or first week. The '23 Tourmalet was on stage 6, the first week of the Tour. While some riders struggle on the first week, particularly in the mountains, it would be difficult to argue that any GC rider would be slower on HC climbs in the first week than in the third week.
Total vertical meters2023 had 3,900 meters (12,800 ft.) of vertical. 2021 was about 10% shy of that at 3,560 m. 2018 had 5,050 m of vertical, nearly 30% more than '23. Again, '18 was a monster.
Distance2023 was 145 km. On the short side but longer than 2021's 130 km. However, 2018 was 200 km, about 25% longer than '23. Those significant variables must have affected each year's Tourmalet climbing strategy.
WeatherThe weather conditions were the worst in 2018 at 38°C (100°F). It was talked about at the time. There was some rain in the '23 stage, but it did not affect the Tourmalet climb.
Note: The TdF's Tourmalet climb has two ascent options — eastbound and westbound. The eastbound climb is the one that everyone tracks closely. The most recent eastbound climb was in 2023. In 2025, the TdF also climbed the Tourmalet, but it was westbound, not eastbound. The two ascents are not comparable or interchangeable. The eastbound climb is more popular, has more data, and has more accurate timing.
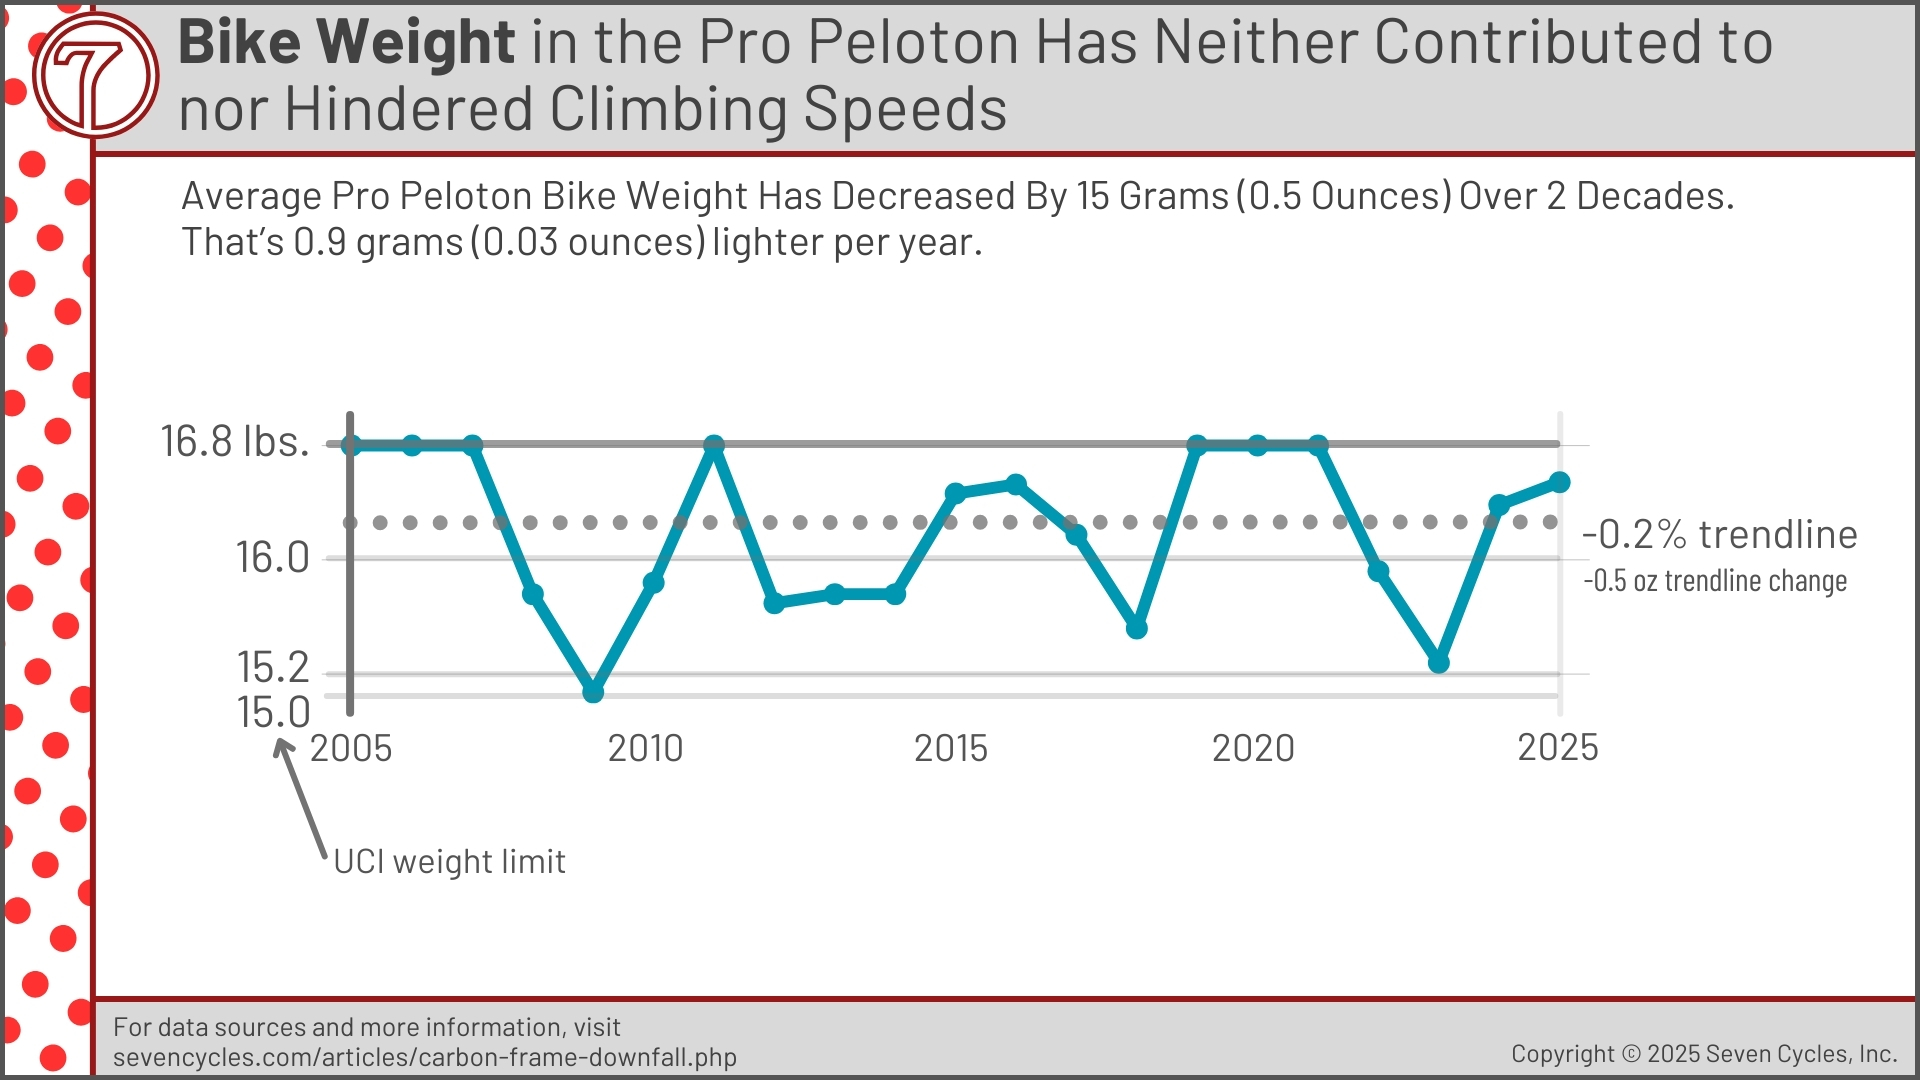
Why would the average speed of HC category climbs have a downward trend over decades? It's not that riders are heavier (see the Rider Weight figure). It's not that bikes are heavier (see the Bike Weights figure). It's not that road surfaces or riding conditions are getting worse. It's not that rider capability is declining.
Seven posits that bike tech is negatively affecting ascent times. As discussed elsewhere, softer drivetrains are less efficient while climbing, lower torsional frame stiffness requires more energy to maintain control while climbing, carbon's harsher ride means more energy expenditure due to bracing, and slower recovery day after day. Ever more aerodynamic bike designs accentuate all of these issues. These seemingly marginal problems all compound to have a measurable negative impact on ascent times.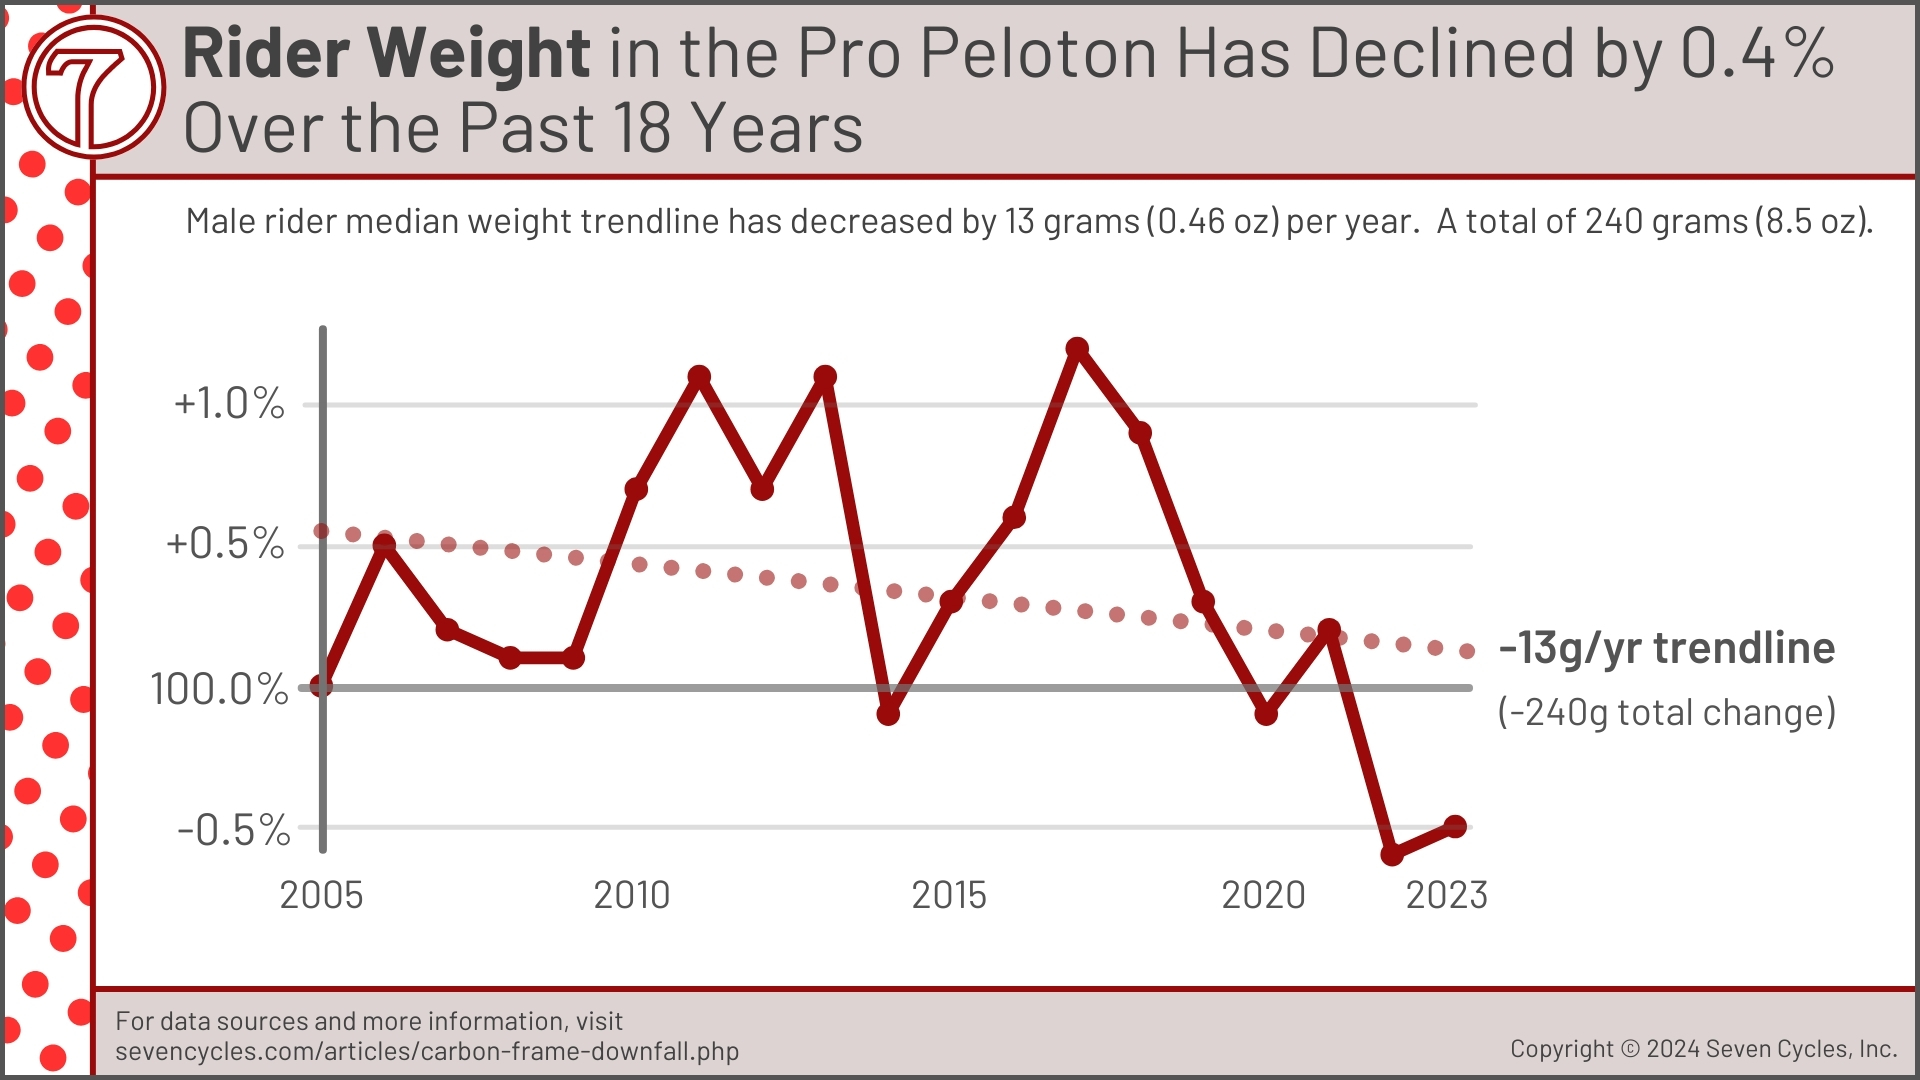
World Tour climbing speeds are not easily compared year to year
Measuring climbing speeds reliably is tricky. Most Tour de France climbs don't recur every year. And there are often multiple ways up a mountain, so measuring one year against another isn't necessarily equal. A good example is Mont Ventoux. It's only been in four stages in the past 20 years.
Does the climb occur at the finish, or is it simply a climb within a stage? Col du Tourmalet is a good example; it has not been the finish in any of its runnings over the past 30 years. (It also has multiple road options up the mountain.) A dozen other factors make the data messy: road quality improves, weather is unpredictable, etc. Regardless, we do what we can with the data that exists.
Read Seven's World Tour race speeds are not easily compared year to year in this white paper for more information.
Now for the REAL problems with ever lighter bikes: Slower descending, more crashes from poor control, and fragility
Lighter Means Slower Descending
Unfortunately for most of us, once we've climbed that hill, we have to get down the other side. The reasons a lighter bike climbs faster on paper are the same reasons that the bike rolls downhill slower. Lighter is slower because of less force available to overcome drag, there's a weaker gravitational force, and less kinetic energy. Any mechanical engineer will agree. But bike brands don't share what happens on the downside of the hill.
The Slow Descents figure below illustrates the real-world results of climbing and descending times, rather than the ever-popular online calculators that only evaluate climbing times. The figure provides a breakdown of actual time saved or lost at different gradients on the 2016 Transcontinental Race (TCR) across Europe.[tcr16] The TCR is a good measure because it accounts for all possible climb types, descents, gradients, terrains, road conditions, and the event is essentially a time trial without peloton riding dynamics. Additionally, the race is long enough (at 2,400 km) that it mitigates any changing weather conditions, wind variations, or single-day nonsense.
The TCR data presented in the Slow Descents figure illustrate that as a bike and rider become lighter, slower descending times offset a significant portion of the climb-time savings. Take, for example, a 3-hour ride at an average speed of 20 mph, on a bike that's 300 grams (0.66 lbs) lighter than on the previous ride on the same route. Over 70% of the climbing time improvements are offset by slower descending times. The rider will save 72 seconds on the climb, but sacrifice 53 seconds on the descent, netting a 19-second benefit. This time variation is not really a holistic benefit for several reasons, as explained below the figure.
Physics be physicing.

Nineteen seconds, as shown in the Slow Descents figure above, is better than zero seconds. So, the lighter bike is still worth it. No, because those 19 seconds are more than offset by the additional downsides of a superlight bike, as explained below.
Lighter Makes Bike Control Suffer
When control is lost, speed slows. Carbon bikes' control issues include:
- The inherent instability resulting from the frame's stiffness degradation with each ride
- Ever-lighter bikes are more challenging to handle and control.
- Superlight carbon bikes ride harsher than a decade ago. (Counterintuitive, but true nonetheless.) The harsher ride saps rider energy and extends recovery time.
Light, But Not Durable
Poor impact and damage tolerance is one consequence of designing frames that are too light. It's so pervasive and problematic that most carbon brands won't warranty their frames if ridden long and hard (read ASTM's Condition 1 riding disclaimer that literally says to expect a "relatively short product life"). Unlike Seven's are designed for. Additionally, many lightweight carbon frames have a 2 or 3-year warranty.
Even when a carbon frame isn't the lightest, it's still the most fragile. It's difficult to mitigate carbon's inherent wear, fatigue, and impact issues regardless of how much material is applied.
Condition 1: Not Durable
Maybe the dirtiest carbon secret of them all: Performance carbon road bikes are considered Condition 1 riding. This means the frame is so light that the rider should expect it to be disposable, likely to fail in a crash, and to have an unreasonably short service life. Is this temporary bike worth saving 200 grams for?
"Condition 1" Bikes Have Extremely Fragile Frames
Text from the owner's manuals of many prestigious carbon bike suppliers clearly describes the durability problems. [sp] [tr] [cd] [gi] [sc] [or] [kn] [md]
The following quote refers to road bikes, which ASTM classifies as "Condition 1" riding and defines as:
The ASTM (American Society for Testing and Materials) calls this a "TRADE OFF." (All caps are their emphasis.)
Is saving a few grams worth this price? Is it a good deal? Don't expect a long service life. Don't dent it. Don't think it as a workhorse. Don't ride in harsh conditions. Don't crash.
Seven does not design or build Condition 1 bikes.
Always remember that warranties only cover material and work defects. Warranties do not cover "wear and tear" or fatigue failure — all of the things defined under Condition 1 riding.
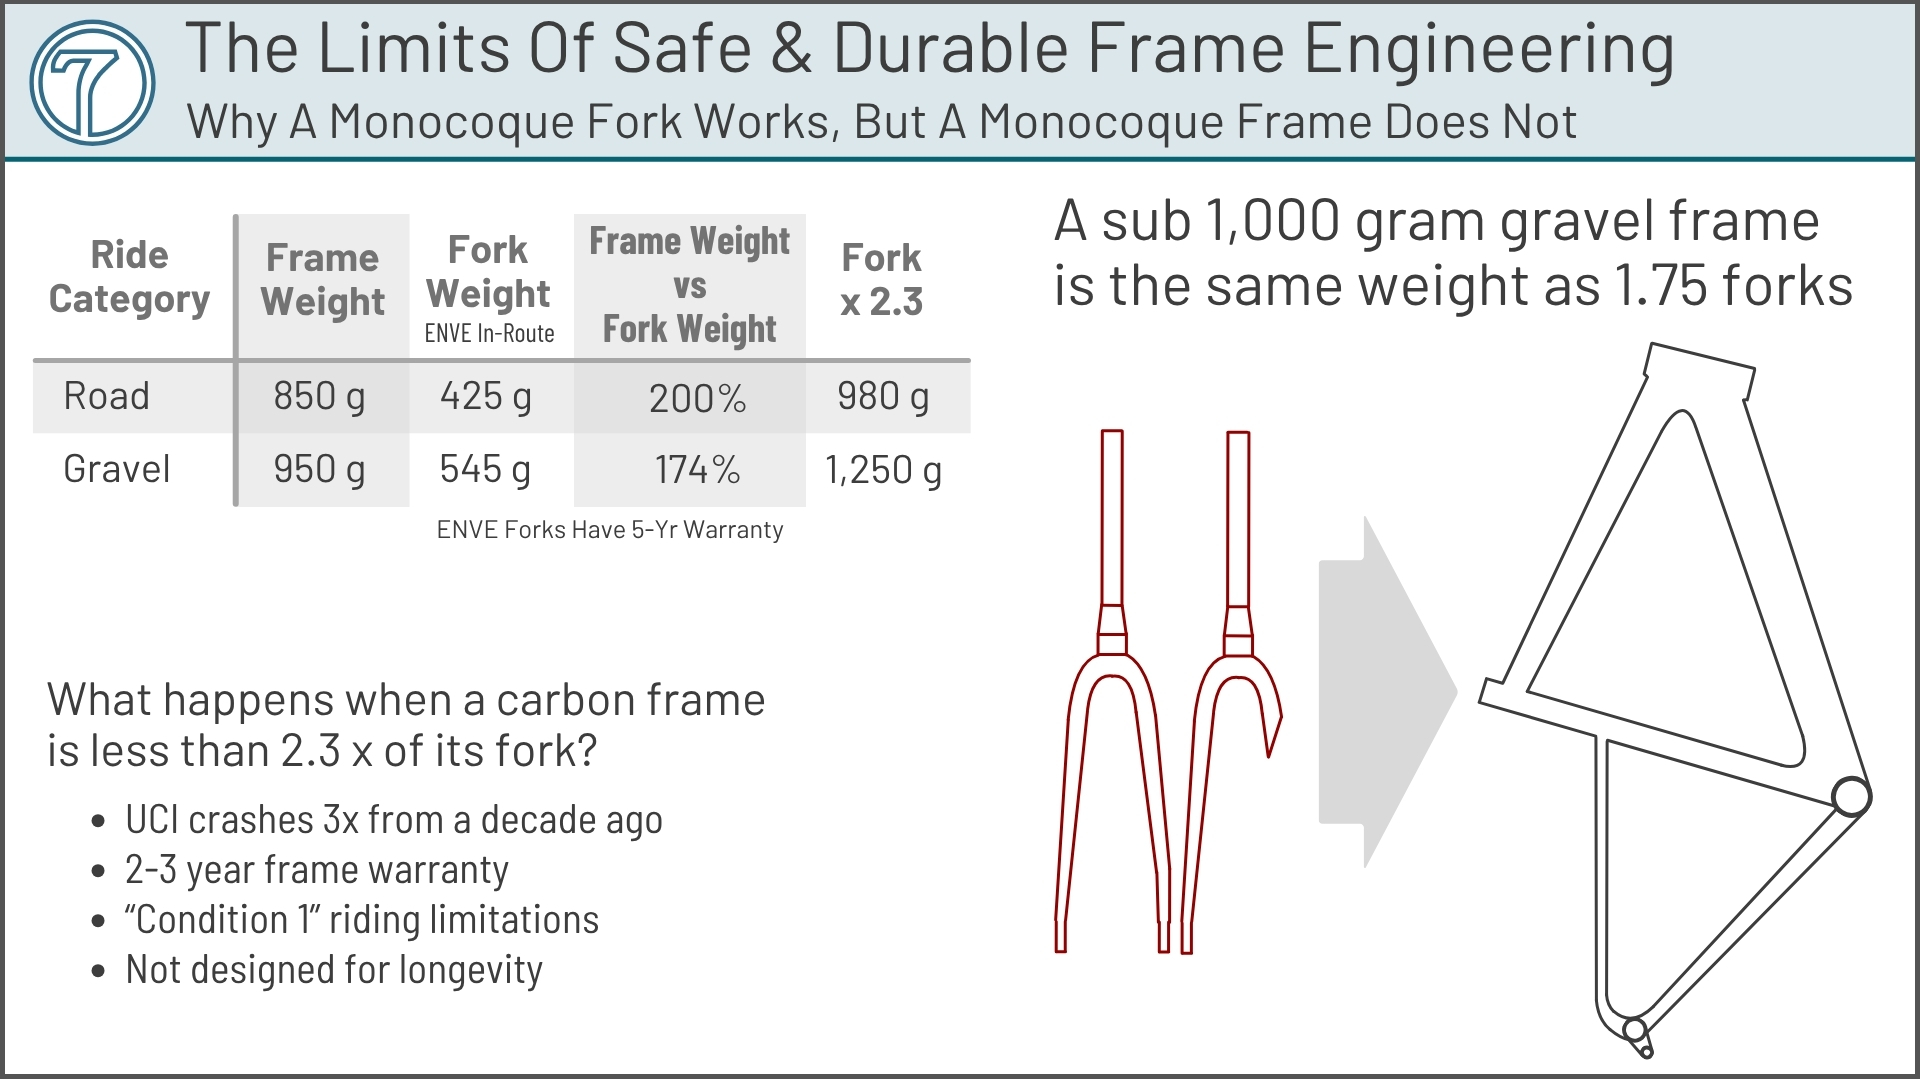
The Frames Are Forks figure illustrates how out of control the pursuit of lightweight has become. Conceptually, the lightest carbon gravel frames are about the weight of 1.75 carbon forks. The lightest carbon road frames are about the weight of about two carbon forks. Clearly, something doesn't make sense.
Warranty Expectations
What happens when frames get under about 1,110 grams? The warranty typically gets much shorter, to something like 2 or 3-year warranty. The frame is short-term and disposable. The chances of crashing increase significantly.
Even the best carbon forks have just a 5-year warranty. Meaning, if a fork only has 5 years, an underbuilt frame must have a shorter lifespan. Bike companies know this; many offer only 2 or 3-year frame warranties.
★ Seven's Frame Weight Differentiation ★
Seven's frames are among the lightest. However, we do not use that as a selling point because it's not a focus for us. Ride quality is so much more beneficial than gram shaving (as explained above). A well-balanced bike feels light.
Opportunities for Speed
We find the real prospects for speed gains are in descending, when you're on switchbacks and hairpins, when control is most important, and when the road gets rough. Those opportunities add up to a lot more time during most rides than seconds saved during climbs.
Fortunately, saving grams has no meaningful benefit on a performance bike of about $7,000 or more. (grams vs. dollars.) ★
More Crashes More Often
The UCI World Tour road racing injury database shows that racing is getting significantly more dangerous. Racer injuries have increased by 300% over the past decade. The causes are demonstrably not attributable to faster race speeds, more traffic furniture, or any other popular crash lore.
The Great Eight (G8) World Tour races have gotten faster by 0.25 km/h per year over the past decade (based on speed data). In contrast, the average number of races per World Tour rider has decreased by more than 9% (based on race days data) over the same time. The average race distance is 2.3% shorter (based on route distance data). The average kilometers raced per season has decreased by about 12% over the decade (reference annual miles data). Tour de France descending meters on big stages decreased by 49% between 2014 and 2025. (reference descending in the Tour de France). These factors and others should decrease crashes and injuries, but, as the More Crashes figure illustrates, they haven't.
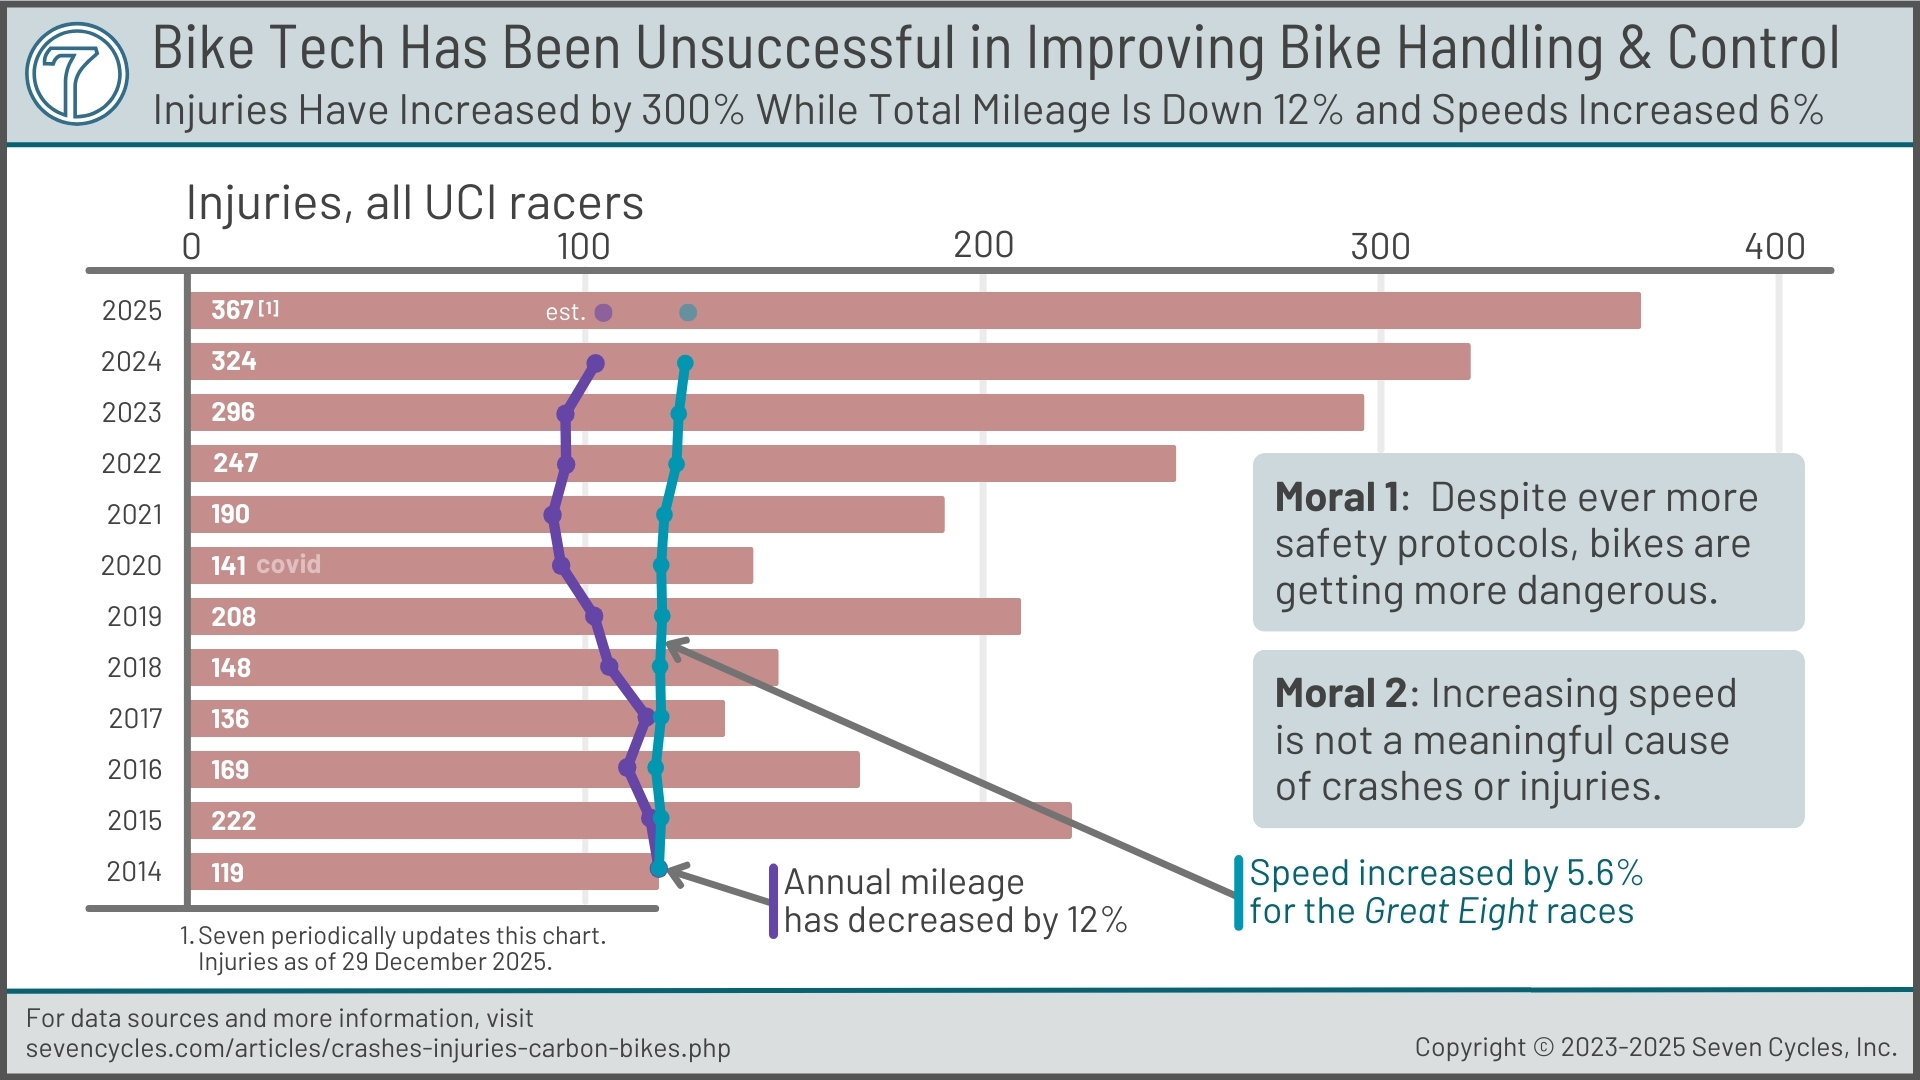
Even more confusing, we've seen 18 significant changes since 2015 that should make racing safer, ranging from wider tires (23 to 30+ mm) to the rider's union (in 2020) to ongoing road surface improvements. Despite all of this, crashes that result in reported injuries continue to increase at an alarming rate.
The common thread is carbon frameset design and its evolution toward ever harsher vertical engineering and greater difficulty to control. Watch crash videos in slow motion, and the lack of frame flex in the vertical and lateral planes becomes clear. Traction loss is the number one issue. Loss of traction is caused by frame stiffness in torsion and the vertical planes. Metal bikes from the 2000s did not have these issues. Riders have taken to larger tires with 60% more contact patch surface area (from 23 mm to 30+ mm) over the past decade, but it's not enough to offset modern carbon traction issues.
Why are frames so stiff? Aerodynamic shapes (in frames, forks, and wheels) and carbon's requirement for generalized stiffness, to delay fatigue failure.
★ Seven's Handling and Control Differentiation ★
The key to good bike handling is complicated. However, there's one aspect of engineering more important than all the rest: Control of frame stiffness in three planes (drivetrain, vertical, front end torsion). 39 years of building more than 70,000 frames in the US has taught us a couple of things, including how to isolate the three planes from each other to optimize performance, including handling and control. This work is not possible with full carbon frames due to their long-term stiffness issues. Nor is it possible with standard stock frames (because tubeset tuning is mostly ignored).
★
For more details, footnotes, and references about the crash epidemic, read our article, More Crashes: The Cost of Progress?
"Why do bike suppliers offer carbon frames if the material has so many problems?"
Here are a few of the reasons:
- Not every rider cares about the things Seven does. We're focused on performance, utility, and longevity. If those are not important to a rider, a carbon bike might be fine.
- A "relatively short product life" is not something most riders realize they're buying until a frame failure or problem arises. At that point, it's too late. All Condition 1 (high-performance road) frames have this "short life" and other caveats.
- The illusory truth effect is real.[ite2] The marketing of carbon frames is so strong (carbon accounts for more than 99% of the high-end market) that bike designers start to believe the hype, thinking that carbon is the answer to all cycling woes. In fact, it's rarely the ideal answer to any critical cycling challenge.
- Visual differentiation: It is much easier to distinguish one molded carbon aesthetic from another; most metal frames look similar. Visual differentiation makes marketing's job easier. Unfortunately, funky shapes tend to make the bike ride and perform worse. ★★ Seven's differentiation is more subtle and often invisible; tubeset design, wall tailoring, durability, and frame geometry are all difficult to see but easy to feel.
- Carbon frames are cheap to manufacture overseas. The production frame assembly process requires zero skill. Anyone can lay up pieces of carbon prepreg. ★★ Seven's metal frames are the opposite; teaching welding and framebuilding is difficult, time-consuming, and expensive. Difficult doesn't necessarily mean better, but when a 20-year master framebuilder works on a frame, it's a bit different than a production carbon layup apprentice.
- Proprietary parts and planned obsolescence. Building with carbon makes it easier than ever to introduce proprietary and integrated parts. Seat posts, bottom brackets, forks, and more. These unique parts often require an entirely new frameset when the old one has a problem. Try to find a proprietary "integrated" headset for a popular carbon bike from 10 years ago. How about an internal seat post bolt from a decade ago? Or even a seat post. ★★ Seven never designs with proprietary parts on our non-suspended frames and forks.
- Most riders don't ride their bikes very much. This masks many of the durability and ride quality issues. Sponsored racers you see on TV don't have to worry about carbon durability because they get multiple new bikes each season. The purpose of this churn is to avoid the failure, softening, and defect issues inherent to carbon. ★★ Seven riders are some of the ridingest in the world. Some of our sponsored riders rode the same bikes for nearly a decade.


Choose Seven Carbon-Titanium or Seven Full Titanium
Whether you decide on Seven's carbon-titanium 622 bike or a full titanium bike, the riding experience and performance, relative to full carbon, is difficult to compare.
Ride Faster and with More Confidence
- Faster climbing because of Seven's significantly stiffer drivetrains on day one and day one hundred, combined with no aero aesthetics.
- Faster descending because of Seven's smoother ride and reduced harshness, no aero aesthetics, tuned sensory feedback, and no affinity for crashing.
- More surefooted handling and bike control due to less harshness, no aero aesthetics, no need for generalized stiffness, and no affinity for crashing.
- Better tracking and traction because of optimal sensory feedback from less harshness, aero aesthetics, and no affinity for crashing.
- Better performance because of better recovery from repeated intense efforts, higher sustained workload, improved post-ride recovery, and improved sensory feedback.
- Worry-free durability because our materials have better impact toughness, abrasion resistance, and better fatigue endurance, and in many cases, a longer warranty.
![]()
Made In The USA
Seven's founding team has been framebuilding in Massachusetts for 39 years. The average tenure is 16.8 years. The average framebuilder has built thousands of frames. There is no more experienced crew in the bike industry. We're also riders of all stripes, from weekly 'cross racers to multiday winter racing to weeklong bikepacking trips. Our team lives the bike dream.
Three Plane DynamicsTM
Seven pioneered the concept of Three Plane Dynamics (TPD) in 1997. This is in opposition to carbon frame design, as shown in the Stiffness Backwards figure above and generalized stiffness above. TPD, in conjunction with tubeset engineering, provides the basis for Seven's unique ride qualities.
Seven starts with the three planes of the frame — vertical, lateral, and torsional, and then applies targeted stiffness to each. We isolate each plane to optimize overall performance:
- Lateral: Seven's unique drivetrain engineering provides optimal acceleration, climbing, and sprinting capability. Stiffer is generally better.
- Torsion: The front-end rotation plane provides bike control and handling surefootedness to avoid crashes.
- Vertical: The vertical plane provides rider recovery.
- Torsion & Flow Combined provide sensory rider feedback.
Read about Seven's tubesets and riding category-matching.
References
∧ [hmfhb]: How Much Faster Have Bikes Got In Just 10 Years? GCN video. 2023.
∧ [trafa]: Chabanov, D. (2023). The Races Are Faster. Are They Cleaner? And Does It Matter? Bicycling Magazine.
∧ [witfcn]: Croxton, J. (2023). What is the fastest bike in the world? Cycling News.
∧ [witfcn1]: Croxton, J. (2023). What is the fastest bike in the world? Cycling News.
∧ [arbttm1]: Kuhnen, R. (2021). Aero road bike test in the wind tunnel Tour Magazine. 2021. "Since the upper body is not present in the measurement, the drag of a real rider is about 50 percent higher."
∧ [arbttm]: Kuhnen, R. (2021). Aero road bike test in the wind tunnel Tour Magazine. 2021. "Since the upper body is not present in the measurement, the drag of a real rider is about 50 percent higher."
∧ [tm01]: Tour Magazine, Germany. Data available with a paid subscription.
∧ [wcfbaf]: Barton, E. (2018). Why Carbon Fiber Bikes Are Failing. Outside Magazine.
∧ [trwbd]: Delaney, B. (2023). A gravel race trashed your bike. Now what?. Video. The Ride with Ben Delaney.
∧ [cf101]: Maniaci, E. (2022). Carbon Fiber 101: Everything you need to know about it. Motion Composites.
∧ [ite1]: The illusory truth effect. Wikipedia.
∧ [witls]: Wilkstrom, M. (2015). What is the lifespan of a carbon frame? VeloNews.
∧ [tsbcf]: (2024). The Science Behind Carbon Fiber: What Makes It Strong And Lightweight? Feral Industries.
∧ [whwrg2]: McLaughlin, R. (2022). Why has World Tour racing gotten so fast? An investigation. VeloNews.
∧ [aa234]: Amiri, A. (2012). Experimental Investigation Of Fatigue Behavior Of Carbon Fiber Composites Using Fully-Reversed Four-Point Bending Test. Page 52, Figure 34.
∧ [aa239]: Amiri, A. (2012). Experimental Investigation Of Fatigue Behavior Of Carbon Fiber Composites Using Fully-Reversed Four-Point Bending Test. Page 58, Figure 39.
∧ [ab6910]: Agarwal, B. et al. (2006). Analysis And Performance Of Fiber Composites. Page 379, Figure 9-10.
∧ [ab6924]: Agarwal, B. et al. (2006). Analysis And Performance Of Fiber Composites. Page 392, Figure 9-24.
∧ [ab6925]: Agarwal, B. et al. (2006). Analysis And Performance Of Fiber Composites. Page 393, Figure 9-25.
∧ [va125]: Vassilopoulos, Anastasios P. et al. (2011). Fatigue of Fiber-Reinforced Composites. Page 32, Figure 2.5 (R=-1).
∧ [va1411]: Vassilopoulos, Anastasios P. et al. (2011). Fatigue of Fiber-Reinforced Composites. Page 100, Figure 4.11 (R=-1).
∧ [tm58]: Tayyebati, M. et al. (2025). Effects of high-cycle fatigue on the viscoelastic properties of epoxy resin. European Journal of Mechanics A/Solids. Figure 8.
∧ Duc, S, et al. (2021). Adding vibrations during high intensity cycling increases acute physiological responses. Journal of Science & Cycling. Vol 10, No. 2
∧ [evdmga]: Filingeri D, Jemni M, Bianco A, Zeinstra E, Jimenez A. (2012). The Effects of Vibration During Maximal Graded Cycling Exercise: A Pilot Study. Journal of Sports Science and Medicine. 2012 Sep 1;11(3):423-9. PMID: 24149349; PMCID: PMC3737925.
∧ [evdmgb]: Filingeri D, Jemni M, Bianco A, Zeinstra E, Jimenez A. (2012). The Effects of Vibration During Maximal Graded Cycling Exercise: A Pilot Study. Journal of Sports Science and Medicine. 2012 Sep 1;11(3):423-9. PMID: 24149349; PMCID: PMC3737925.
∧ [evdmgc]: Filingeri D, Jemni M, Bianco A, Zeinstra E, Jimenez A. (2012). The Effects of Vibration During Maximal Graded Cycling Exercise: A Pilot Study. Journal of Sports Science and Medicine. 2012 Sep 1;11(3):423-9. PMID: 24149349; PMCID: PMC3737925.
∧ [evdmgd]: Filingeri D, Jemni M, Bianco A, Zeinstra E, Jimenez A. (2012). The Effects of Vibration During Maximal Graded Cycling Exercise: A Pilot Study. Journal of Sports Science and Medicine. 2012 Sep 1;11(3):423-9. PMID: 24149349; PMCID: PMC3737925.
∧ [evdmge]: Filingeri D, Jemni M, Bianco A, Zeinstra E, Jimenez A. (2012). The Effects of Vibration During Maximal Graded Cycling Exercise: A Pilot Study. Journal of Sports Science and Medicine. 2012 Sep 1;11(3):423-9. PMID: 24149349; PMCID: PMC3737925.
∧ [evdmgf]: Filingeri D, Jemni M, Bianco A, Zeinstra E, Jimenez A. (2012). The Effects of Vibration During Maximal Graded Cycling Exercise: A Pilot Study. Journal of Sports Science and Medicine. 2012 Sep 1;11(3):423-9. PMID: 24149349; PMCID: PMC3737925.
∧ inrng.com. (2022). The Calorie Revolution. The Inner Ring, 15 September 2022
∧ [Relevant data: Aluminum 6061 T6 welded fatigue strength of 186 MPa (at 10^7 R=0.5).] Kery, S. (2005). Fatigue Life Prediction For The Development Of Ship Board Exposed Equipment. Proceedings of OCEANS 2005 MTS/IEEE. Figure 3.
∧ [hsttk]: Instagram heraldsuntour (2018). Trek frame failure.
∧ [whwrg]: McLaughlin, R. (2022). Why has World Tour racing gotten so fast? An investigation. Velo Magazine.
∧ [ugdmb]: Rook, A. (2023). Unbound Gravel destroyed my bike.. Cycling Weekly.
∧ [ugdmbb]: Rook, A. (2023). Unbound Gravel destroyed my bike.. Cycling Weekly.
∧ [Relevant data: Epoxy resin fatigue strength average of 34 MPa (at 10^7 R=1).] Tao, G. (2007). Multiaxial Fatigue of an Epoxy Polymer. University of Alberta. Figures 3.29, 3.38, 4.8, and 4.18.
∧ [Relevant data: Epoxy resin fatigue strength of 0 MPa (at 10^7 R=0.99).] Tayyebati, M. (2025). Effects of high-cycle fatigue on the viscoelastic properties of epoxy resin. European Journal of Mechanics, Volume 112, July-August 2025. Figure 8.
∧ [idlpc]: IDL Pro Cycling (2024). Specialized S Works crashed and totaled.
∧ Viellehner, Josef; Potthast, Wolfgang. (2021). The Effect of Cycling-specific Vibration on Neuromuscular Performance. Medicine & Science in Sports & Exercise 53(5), p 936-944, May 2021. | DOI: 10.1249/MSS.0000000000002565
∧ [tcr16]: White, C. (2016). The Actual Effect of Weight on Cycling Speed. The Transcontinental Race, 2016. Ride Far website.
∧ [ite2]: The illusory truth effect. Wikipedia.
∧ Saving 0.4% weight: The lightest functional carbon gravel frame is about 850 grams. Seven's lightest model is about 1,200 grams. That's a 350-gram difference. A lightest carbon bike, being ridden, is about 88.5 kg. (with bike, rider, and equipment). That's a 0.4% weight difference. The bike alone as a weight measure is irrelevant because it doesn't ride itself. The rider, hydration, etc., all need to get up that hill, too. Zero-point-four-percent weight savings are irrelevant to overall speed.
∧ Saving 0.4% weight: The lightest functional carbon gravel frame is about 850 grams. Seven's lightest model is about 1,200 grams. That's a 350-gram difference. A lightest carbon bike, being ridden, is about 88.5 kg. (with bike, rider, and equipment). That's a 0.4% weight difference. The bike alone as a weight measure is irrelevant because it doesn't ride itself. The rider, hydration, etc., all need to get up that hill, too. Zero-point-four-percent weight savings are irrelevant to overall speed.
∧ From about $7,000 and above, weight savings opportunities become negligible. For example, a 300-gram savings is likely to cost $1,000 or more. The cost per gram increases as the total bike price increases.
∧ The Great Eight races were slower in the first half of 2025 vs. the first half of 2024. This includes four Monuments (Liege-Bastogne-Liege, Paris-Roubaix, Tour of Flanders, and Milan-San Remo) and the first Grand Tour (Giro). Average race speeds were 44.18 km/h in 2025 and 44.24 km/h in 2024. Data source: UCI publicly available information.
∧ The Great Eight (G8) is Seven's term for the three grand tours (the Giro, the Tour de France, and the Vuelta) along with the five Monuments (Liege-Bastogne-Liege, Paris-Roubaix, Tour of Flanders, Milan-San Remo, and Il Lombardia). The G8 is a useful shorthand to represent the World Tour in a more manageable number of races for data collection and maintenance purposes.
∧ Average Speed Change: The Great Eight (reference G8) races averaged 40.66 km/h in 2014 and 43.54 km/h in 2025 (year-to-date). That's an annual speed increase of 0.25 km/h.
∧ Race Distance: The average distance of the Great Eight (reference G8) races was 2.1% shorter in 2021 than in 2014. The five Monuments were 0.5% shorter. The three Grand Tours (totalling 63 stages) were 2.3% shorter. The G8 route distances have been declining for more than a decade.
∧ Race Days: The 10th-ranked UCI rider had 95 races in 2014. In 2024, it was 87, an 8.4% drop. The 100th-ranked rider raced 84 in 2014 and 74 in 2024, an 11.9% drop. On average, the number of race days fell by about 9%, conservatively.
∧ Annual Mileage: The average number of races for the 10th and 100th-ranked riders multiplied by the average distance for the Great Eight (reference G8) dropped by 12% from 2014 to 2024. This was due to fewer race days and shorter routes.
∧ Descending: The big mountain stages in the Tour de France have total descending meters of 16,760 in 2014 vs 8,505 in 2025. That's a 49% reduction in descending. Descending is one of the most dangerous things a pro road racer can do. And yet, even with significantly less descending, crash injuries per meter of descending have doubled between 2014 and 2025. Gathering descending data is tedious.
∧ Tour de France Total Distance: Over the past decade, the TdF distance has declined by 6.2%. The distances have been declining throughout the decade.
∧ [12wt]: We start with 3.3 watts from Figure Only 3 Watts. This provides the math for watts gained from improvements between 1990 and 2025. If we take instead a bike from a decade ago (2015), because that's more likely the bike purchasing timeframe, it's fair to claim gains of 1 to 2 watts. Safe to assume there had been some aero improvement before 2015. To support this hypothesis, Cervelo claims a 2-watt gain for their latest S5 frameset. And, of course, this is in a wind tunnel at probably 45 km/h or higher, with no rider on board. Add those two elements and 2 watts, and you get about 0.2 watts. (Figure Only 3 Watts explains that math.) Cervelo data source: 2026 Cervelo S5 Review. Nero Cycling. Video at 10:23. (2025)
∧ [12wtb]: We start with 3.3 watts from Figure Only 3 Watts. This provides the math for watts gained from improvements between 1990 and 2025. If we take instead a bike from a decade ago (2015), because that's more likely the bike purchasing timeframe, it's fair to claim gains of 1 to 2 watts. Safe to assume there had been some aero improvement before 2015. To support this hypothesis, Cervelo claims a 2-watt gain for their latest S5 frameset. And, of course, this is in a wind tunnel at probably 45 km/h or higher, with no rider on board. Add those two elements and 2 watts, and you get about 0.2 watts. (Figure Only 3 Watts explains that math.) Cervelo data source: 2026 Cervelo S5 Review. Nero Cycling. Video at 10:23. (2025)
∧ [vdm]: The VdM Speed Predictor is a calculator we built at Seven. It factors seven speed modifiers, including total climbing, the number and type of categorized climbs, total distance, road surface conditions, and the amount of descending. We do not factor in aerodynamic advancements or technological improvements because they do not appear to affect racing in any measurable way.
∧ Condition 1 riding is described in the Specialized owner's manual
∧ Condition 1 riding is described in the Trek owner's manual
∧ Condition 1 riding is described in the Cannondale owner's manual
∧ Condition 1 riding is described in the Giant owner's manual
∧ Condition 1 riding is described in the Scott owner's manual
∧ Condition 1 riding is described in the Orbea owner's manual
∧ Condition 1 riding is described in the Kona owner's manual
∧ Condition 1 riding is described in the Mondraker owner's manual
Footnotes for Figure: One Example Of Many
- All Tour de France data sourced from publicly available UCI statistics.
Footnotes for Figure: Aero Slow Roll
- +0.16% speed gain each year: Average winning time speed change for the three Grand Tours (Giro, Tour, and Vuelta) from 1998 to 2024. This is the best possible result because the data assume that 100% of the gains are due to aerodynamic improvements, which is obviously the case. All Grand Tour data sourced from publicly available UCI statistics.
- -3.7% pro speed loss: Tour de France data for 2016 through 2025. The average speed divergence between 1st and 40th place is a 3.7% speed decline as shown in the TdF Speed Divergence" figure. All Tour de France data sourced from publicly available UCI statistics.
- -17% traction & tracking: Over the past decade, popular carbon frames have gotten 17% stiffer in the vertical plane. This makes traction and tracking more difficult. The data is also illustrated in the "Stiffness Backwards figure." Data sourced from product testing published by Tour Magazine, Germany. Data available with a paid subscription.
- -21% rider efficiency: This is a combination of muscular activation efficiency (an 11% decline), VO2 efficiency (a 22% decline), VO2 volume (a 35% decline), work rate VO2 (a 17% decline), as shown in the "Poor Recovery" figure.
- -23% training effectiveness: This is a combination of lactate threshold (a 22% decline) and blood lactate flushing (a 24% decline) as shown in the "Poor Recovery" figure.
- -24% rider recovery: This is a combination of heart rate efficiency (a 27% decline) and blood lactate flushing (a 22% decline) as shown in the "Poor Recovery" figure.
- -66% handling & control: This is the increase in World Tour road injuries due to crashing over the past decade, as illustrated in the "More Crashes" figure. Data sourced from publicly available UCI statistics.
Footnotes for Figure: Not So Fast
- -0.6% descending speed: Calculated from Transcontinental Race times as enumerated in the "Slow Descents" figure.
- -1.4% Speed Prediction: Determined by Seven's Speed Predictor. The VdM Speed Predictor is a calculator we built at Seven. It factors seven speed modifiers, including total climbing, the number and type of categorized climbs, total distance, road surface conditions, and the amount of descending. We do not factor in aerodynamic advancements or technological improvements because they do not appear to affect racing in any measurable way.
- -3.7% pro speed loss: Tour de France data for 2016 through 2025. The average speed divergence between 1st and 40th place is a 3.7% speed decline, as shown in the "TdF Speed Divergence" figure. All Tour de France data sourced from publicly available UCI statistics.
- -4.5% climbing speed: Data extracted from the "Climbs Are Slower" figure. Tour de France overall speeds have increased by 2.8% over the past 30 years. TdF climbs have gotten 1.7% slower over the same time period.
- -17% traction & tracking: Over the past decade, popular carbon frames have gotten 17% stiffer in the vertical plane. This makes traction and tracking more difficult. The data is also illustrated in the "Stiffness Backwards figure." Data sourced from product testing published by Tour Magazine, Germany. Data available with a paid subscription.
- -24% rider recovery: This is a combination of heart rate efficiency (a 27% decline) and blood lactate flushing (a 22% decline) as shown in the "Poor Recovery" figure.
- -66% handling & control: This is the increase in World Tour road injuries due to crashing over the past decade, as illustrated in the "More Crashes" figure. Data sourced from publicly available UCI statistics.
Footnotes for Figure: Light, Not Fast
- -4.5% climbing speed: Data extracted from the "Climbs Are Slower" figure. Tour de France overall speeds have increased by 2.8% over the past 30 years. TdF climbs have gotten 1.7% slower over the same time period.
- -10% drivetrain stiffness: Data from ongoing product testing published by Tour Magazine, Germany. Data available with a paid subscription.
- -17% smoothness: Over the past decade, popular carbon frames have gotten 17% stiffer in the vertical plane. This makes traction and tracking more difficult. The data is also illustrated in the "Stiffness Backwards figure." Data sourced from product testing published by Tour Magazine, Germany. Data available with a paid subscription.
- -21% rider efficiency: This is a combination of muscular activation efficiency (an 11% decline), VO2 efficiency (a 22% decline), VO2 volume (a 35% decline), work rate VO2 (a 17% decline), as shown in the "Poor Recovery" figure.
- -23% training effectiveness: This is a combination of lactate threshold (a 22% decline) and blood lactate flushing (a 24% decline) as shown in the "Poor Recovery" figure..
- -24% rider recovery: This is a combination of heart rate efficiency (a 27% decline) and blood lactate flushing (a 22% decline) as shown in the "Poor Recovery" figure.
- -66% handling & control: This is the increase in World Tour road injuries due to crashing over the past decade, as illustrated in the "More Crashes" figure. Data sourced from publicly available UCI statistics.
Footnotes for Figure: Less Stiff This Decade
- Ongoing product testing published by Tour Magazine, Germany. Data available with a paid subscription.
Footnotes for Figure: Stiffness Backwards
- Ongoing product testing published by Tour Magazine, Germany. Data available with a paid subscription.
Footnotes for Figure: Softer Drivetrains
- Ongoing product testing published by Tour Magazine, Germany. Data available with a paid subscription.
Footnotes for Figure: Carbon Stiffness Declines Over Time
- Vassilopoulos, Anastasios P. et al. (2011). Fatigue of Fiber-Reinforced Composites. Page 129, Figure 4.31.
- Castro, Oscar, et al. (2019). Effect of matrix cracks on stiffness degradation of laminated composite beams. 22nd International Conference on Composite Materials. Page 1, Figure 1.
- Eliasson, Sara (2023). A Framework for Fatigue Analysis of Carbon Fiber Reinforced Polymer Structures KTH Royal Institute of Technology. Pages 15-18, Figure 2.9 & Figure 2.11.
- Forney, Clyde (1990). Ti-3Al-2.5V Seamless Tubing Engineering Guide, (Third Edition). Page 35.
- Donachie, Matthew, Jr. (2000). Titanium: A Technical Guide, (Second Edition). Pages 159-164.
Footnotes for Figure: Carbon's 36% Fatigue
- Forney, Clyde (1990). Ti-3Al-2.5V Seamless Tubing Engineering Guide, (Third Edition). Page 35.
- Donachie, Matthew, Jr. (2000). Titanium: A Technical Guide, (Second Edition). Pages 159-164.
- Vassilopoulos, Anastasios P. et al. (2011). Fatigue of Fiber-Reinforced Composites. Page 32, Figure 2.5 (R=-1).
- Vassilopoulos, Anastasios P. et al. (2011). Fatigue of Fiber-Reinforced Composites. Page 100, Figure 4.11 (R=-1).
- ∧ [Relevant data: Aluminum 6061 T6 welded fatigue strength of 186 MPa (at 10^7 R=0.5).] Kery, S. (2005). Fatigue Life Prediction For The Development Of Ship Board Exposed Equipment. Proceedings of OCEANS 2005 MTS/IEEE. Figure 3.
- [Relevant data: Epoxy resin fatigue strength average of 34 MPa (at 10^7 R=1).] Tao, G. (2007). Multiaxial Fatigue of an Epoxy Polymer. University of Alberta. Figures 3.29, 3.38, 4.8, and 4.18.
- [Relevant data: Epoxy resin fatigue strength of 0 MPa (at 10^7 R=0.99).] Tayyebati, M. (2025). Effects of high-cycle fatigue on the viscoelastic properties of epoxy resin. European Journal of Mechanics, Volume 112. July-August 2025. Figure 8.
Footnotes for Figure: Carbon Off-Axis Fatigue Drop
- Vassilopoulos, Anastasios P. et al. (2011). Fatigue of Fiber-Reinforced Composites. Page 79, Figure 3.1 (R=10).
- Vassilopoulos, Anastasios P. et al. (2011). Fatigue of Fiber-Reinforced Composites. Page 80, Figure 3.4 (R=10).
- Vassilopoulos, Anastasios P. et al. (2011). Fatigue of Fiber-Reinforced Composites. Page 81, Figure 3.6 (R=0.1).
Footnotes for Figure: Only Three Watts
- Outside Magazine wind tunnel tests show that at 55 mph, a contemporary aero bike (2021 Cervelo S5) saves 52 watts over a 1990 Eddy Merckx steel bike.
- Cycling News article.
- Cervelo's website says of the 2025 S5 compared to the 2022 S5:
- "The new S5 is 6.3 Watts faster than its predecessor [the 2022 version]." We assume this number is from wind-tunnel testing at 55 km/h with no rider on board. This translates to 1.4 watts at 20 mph. Factor in the rider on the bike, riding in a peloton, it brings the bike to 0.4 watts benefit.
- "The new S5's one-piece bar and stem is a big part of the bike's increase in aerodynamic performance." This indicates that the frame is not so different from the previous generation.
- Black, B, et al. (2018). Aerodynamic drag in cycling pelotons: New insights by CFD simulation and wind tunnel testing. Journal of Wind Engineering and Industrial Aerodynamics, Volume 179, August 2018. Pages 319-337, Figure 21, Peloton B.
- Aero Vs Climbing Bike — The REAL Difference Wind Tunnel Tested video by CADE Media shows a 27% difference in watts of drag between bike-only and rider-on-bike in a wind tunne, 3.7 watts vs 2.7 watts.
- Speed gains of 3.3 watts are more than offset by slower speeds due to handling issues, traction reduction, climbing, cornering, and more.
- "35 years" is determined by the gap between the 1990 steel reference bike and a 2025 Cervelo S5, which matches the 2021 Visma team bike exactly.[1] [2] [3]
- "0.04%" is determined by 3.3 watts divided by 230 watts (an average for 20 mph sustained speed) = 1.43% improvement. 1.43% divided by 35 years[9] = 0.04% improvement per year.
- Road Bike UK presents the average watts needed to ride at various speeds and the average watts required to increase speed.
- Speed Distance Time Calculator provides time savings as rider speed changes.
Footnotes for Figure: Time Trial Speed
- All Tour de France data sourced from publicly available UCI statistics.
Footnotes for Sidebar: Aerodynamics Squared Vs. Cubed: Faster Riders Gain Less Speed
∧ [bdaa]: Calculation details at bikedynamics.co.uk.
Footnotes for Figure: TdF Speed Divergence
- All Tour de France data sourced from publicly available UCI statistics.
Footnotes for Figure: Harsher Every Year
- Ongoing product testing published by Tour Magazine, Germany. Data available with a paid subscription.
Footnotes for Figure: Seven is 400% Smoother
- Ongoing product testing published by Tour Magazine, Germany. Data available with a paid subscription.
- Seven data source: In-house testing.
Footnotes for Figure: Poor Recovery
- Viellehner, Josef; Potthast, Wolfgang. (2021). The Effect of Cycling-specific Vibration on Neuromuscular Performance. Medicine & Science in Sports & Exercise 53(5), p 936-944, May 2021. | DOI: 10.1249/MSS.0000000000002565
- Filingeri D, Jemni M, Bianco A, Zeinstra E, Jimenez A. (2012). The Effects of Vibration During Maximal Graded Cycling Exercise: A Pilot Study. Journal of Sports Science and Medicine. 2012 Sep 1;11(3):423-9. PMID: 24149349; PMCID: PMC3737925.
- Duc, S, et al. (2021). Adding vibrations during high intensity cycling increases acute physiological responses. Journal of Science & Cycling, Vol 10, No. 2
Footnotes for Figure: Il Lombardia Performance Suffering
- All Tour de France data sourced from publicly available UCI statistics.
Footnotes for Figure: Speed Prediction 40th Place
- All Tour de France data sourced from publicly available UCI statistics.
- Seven's VdM Speed Predictor is a calculator we built at Seven. It factors seven speed modifiers, including total climbing, the number and type of categorized climbs, total distance, road surface conditions, and the amount of descending. We do not factor in aerodynamic advancements or technological improvements because tehy do not appear to affect racing in any measurable way.
Footnotes for Figure: Speed Prediction, Winner
- All Tour de France data sourced from publicly available UCI statistics.
- Seven's VdM Speed Predictor is a calculator we built at Seven. It factors seven speed modifiers, including total climbing, the number and type of categorized climbs, total distance, road surface conditions, and the amount of descending. We do not factor in aerodynamic advancements or technological improvements because tehy do not appear to affect racing in any measurable way.
Footnotes for Sidebar: Technology Squared Vs. Cubed: Faster Riders Gain Less Speed
∧ [bdab]: Calculation details at bikedynamics.co.uk.
Footnotes for Figure: 40th vs. 10th Divergence
- All Tour de France data sourced from publicly available UCI statistics.
Footnotes for Figure: Ventoux Speeds
- All Mont Ventoux data sourced from publicly available UCI statistics.
Footnotes for Figure: Less Climbing Means More Speed
- All Tour de France data sourced from publicly available UCI statistics.
Footnotes for Figure: Climbs Are Slower
- All Tour de France data sourced from publicly available UCI statistics.
Footnotes for Figure: Tourmalet Outlier
- All Tour de France data sourced from publicly available UCI statistics.
Footnotes for Figure: Rider Weight Trend
- Crisp, S. (2023). Height and Weight — Changing Trends in the Pro/WorldTour. sicycle.wordpress.com
Footnotes for Figure: Bike Weight Trend
- Wong, F. (updated 2025). Height and Weight — Changing Trends in the Pro/WorldTour. sicycle.wordpress.com
- Tempo (2024). Bike weights in the pro peloton, why so heavy?. tempocyclist.com
- Huckle, O. (2024). How much do Tour de France bikes weigh in 2024? 9 Tour bikes weighed and analysed. bikeradar.com
Footnotes for Figure: 74 Seconds Saved per 100km at 20 MPH
- White, C. (2016). The Actual Effect of Weight on Cycling Speed. The Transcontinental Race, 2016. Ride Far website.
Footnotes for Figure: The Limits of Safe & Durable Frame Engineering
- 300% increase in crash injuries: All Tour de France data sourced from publicly available UCI statistics.
- 3T warranty as of 2025: 2 years
- BMC warranty as of 2025: 3 years
- Canyon warranty as of 2025: 6 years
- Colnago warranty as of 2025: 2 years
- Enve Composites warranty as of 2025: 5 years
- Open Cycles warranty as of 2025: 3 years
- Pinarello warranty as of 2025: 2 years
- Scott Bikes warranty as of 2025: 3 years
- Willier warranty as of 2025: 2 years
Footnotes for Figure: Bike Tech Has Been Unsuccessful in Improving Bike Handling & Control
- All injury, mileage, and speed data sourced from publicly available UCI statistics.
- The Great Eight (G8) is Seven's term for the three grand tours (the Giro, the Tour de France, and the Vuelta) along with the five Monuments (Liege-Bastogne-Liege, Paris-Roubaix, Tour of Flanders, Milan-San Remo, and Il Lombardia). The G8 is a useful shorthand for representing the World Tour in a more manageable number of races for data collection and maintenance purposes.
- Annual mileage is based on the total G8 race distances and the number of races the 10th-ranked rider participates in each year. Race distances on average have gotten shorter over the past decade. The total number of races the pros participate in has been steadily declining over the past decade.