
Road Furniture Does not Cause a Significant Portion of UCI Race Crashes and Injuries
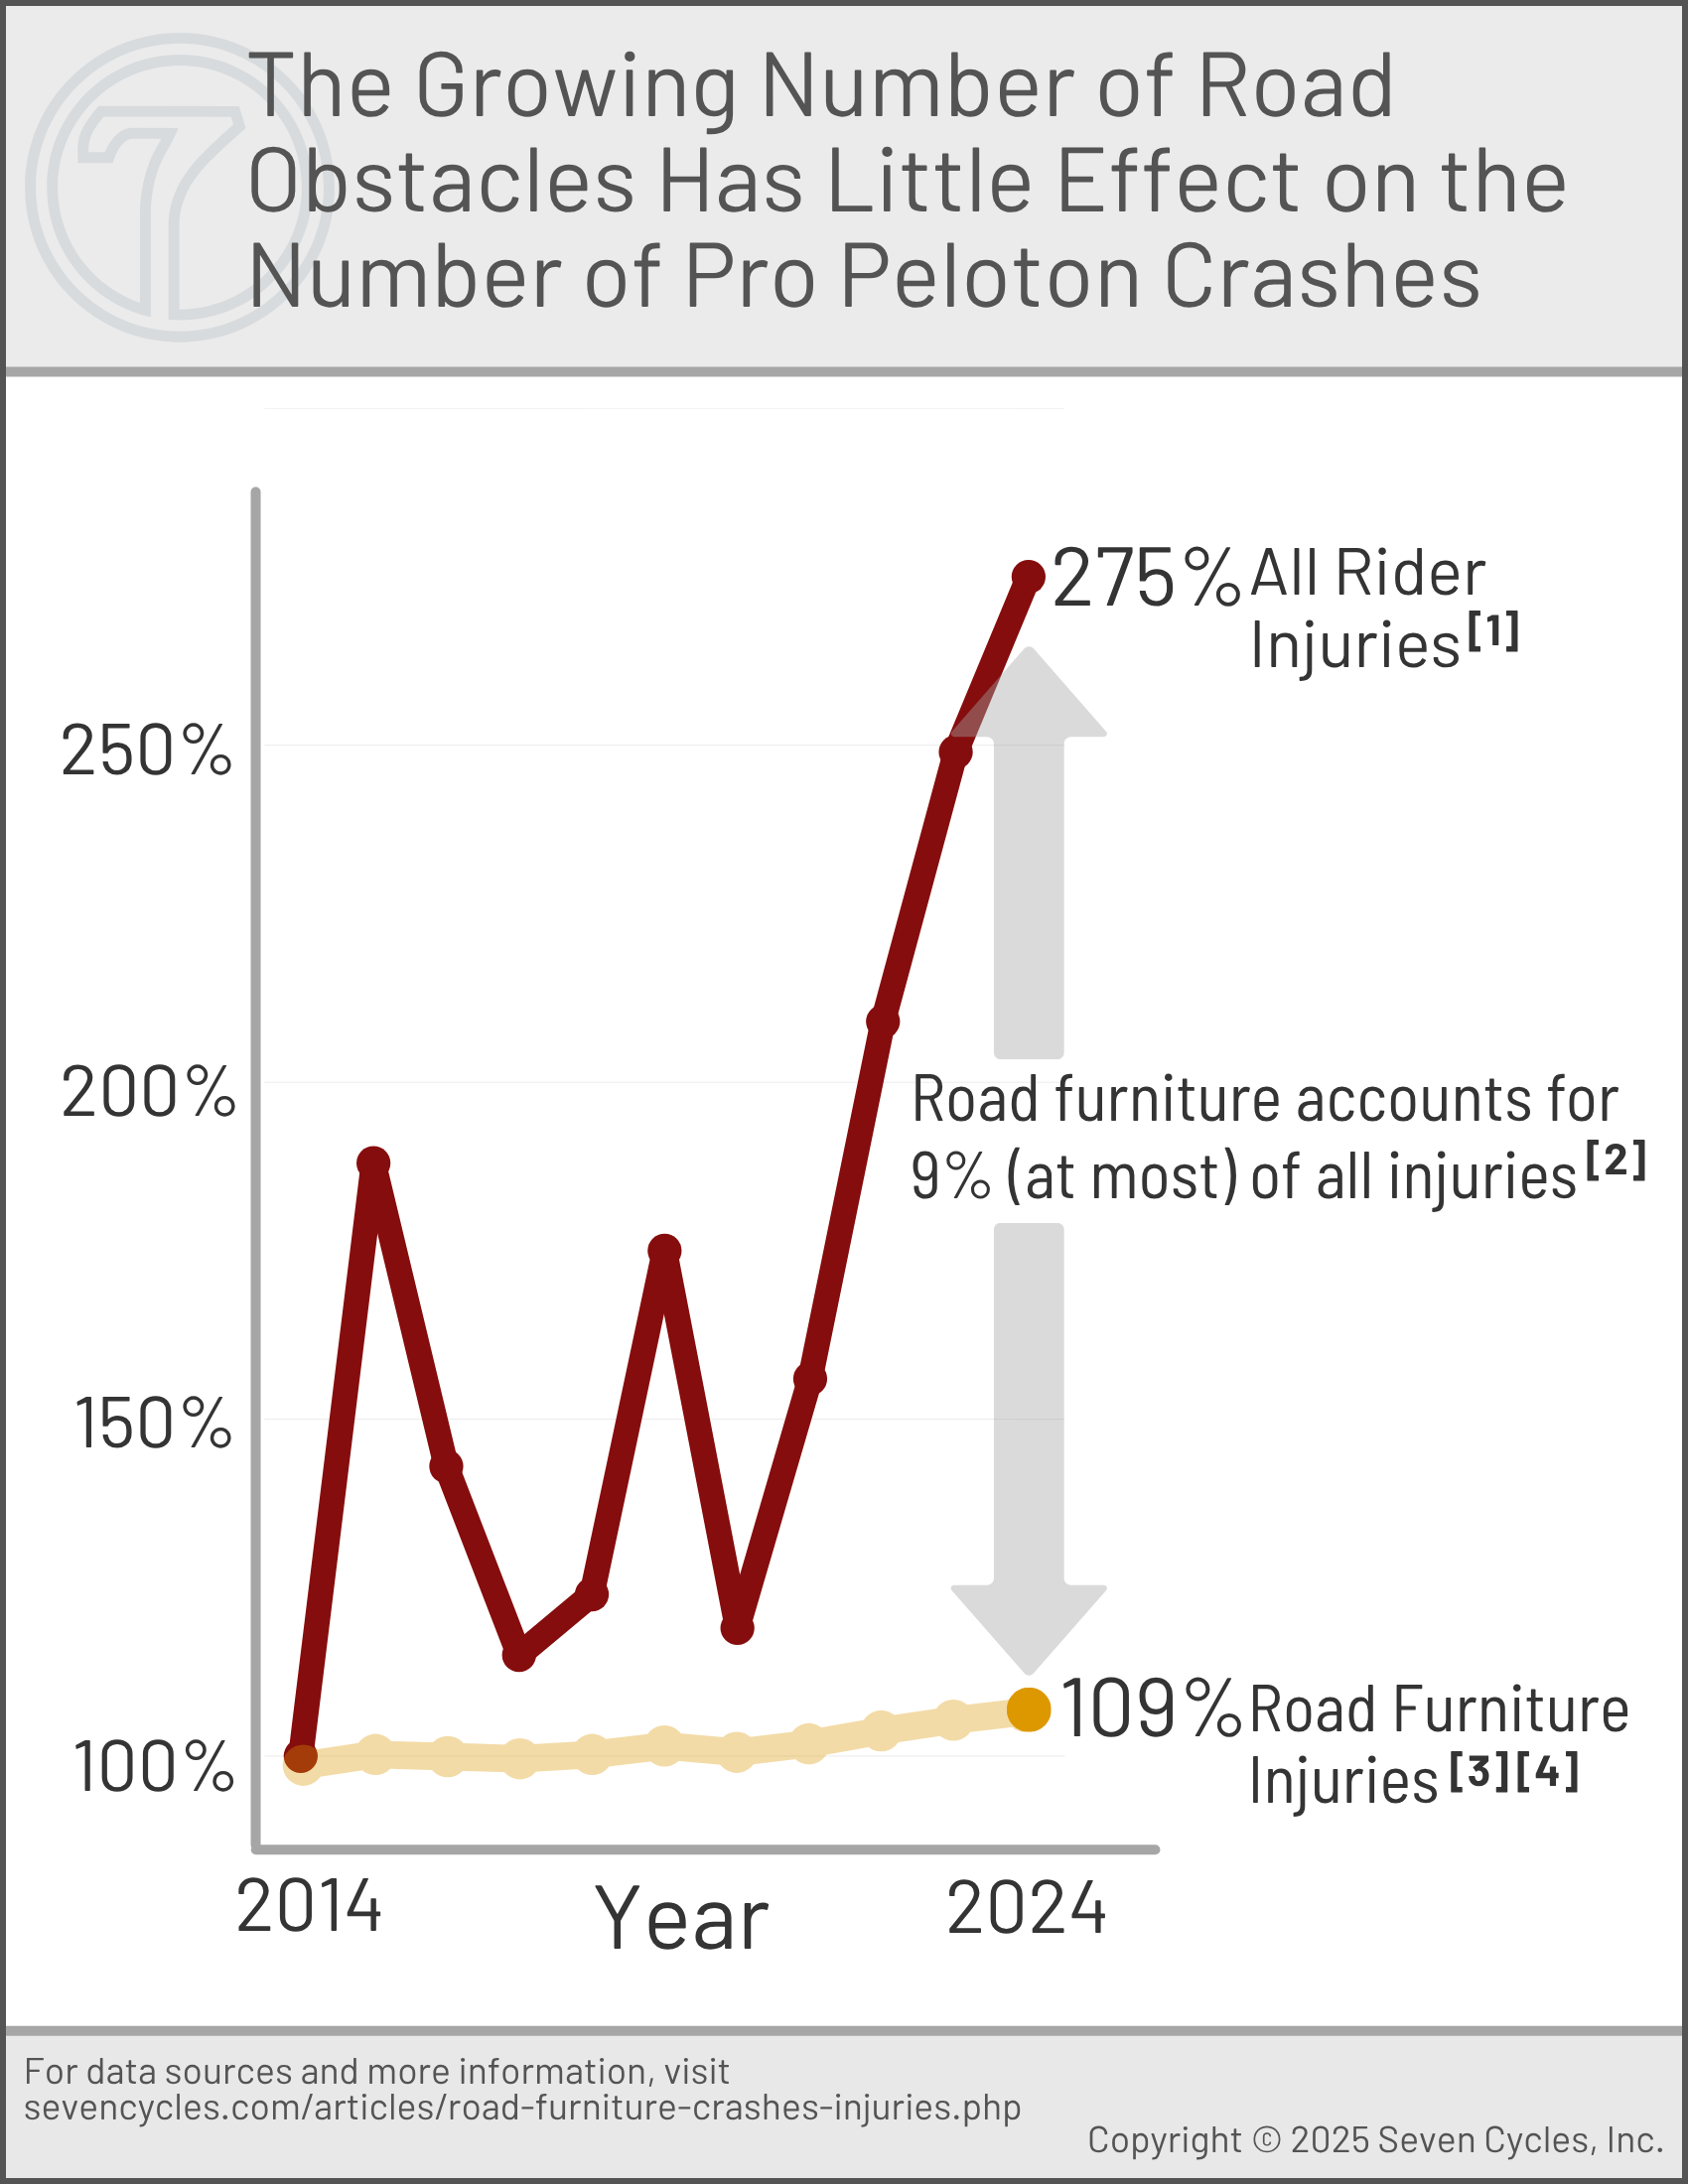
The most generous reading of the data suggests that collisions with traffic-easing infrastructure account for less than 9% of all injuries.
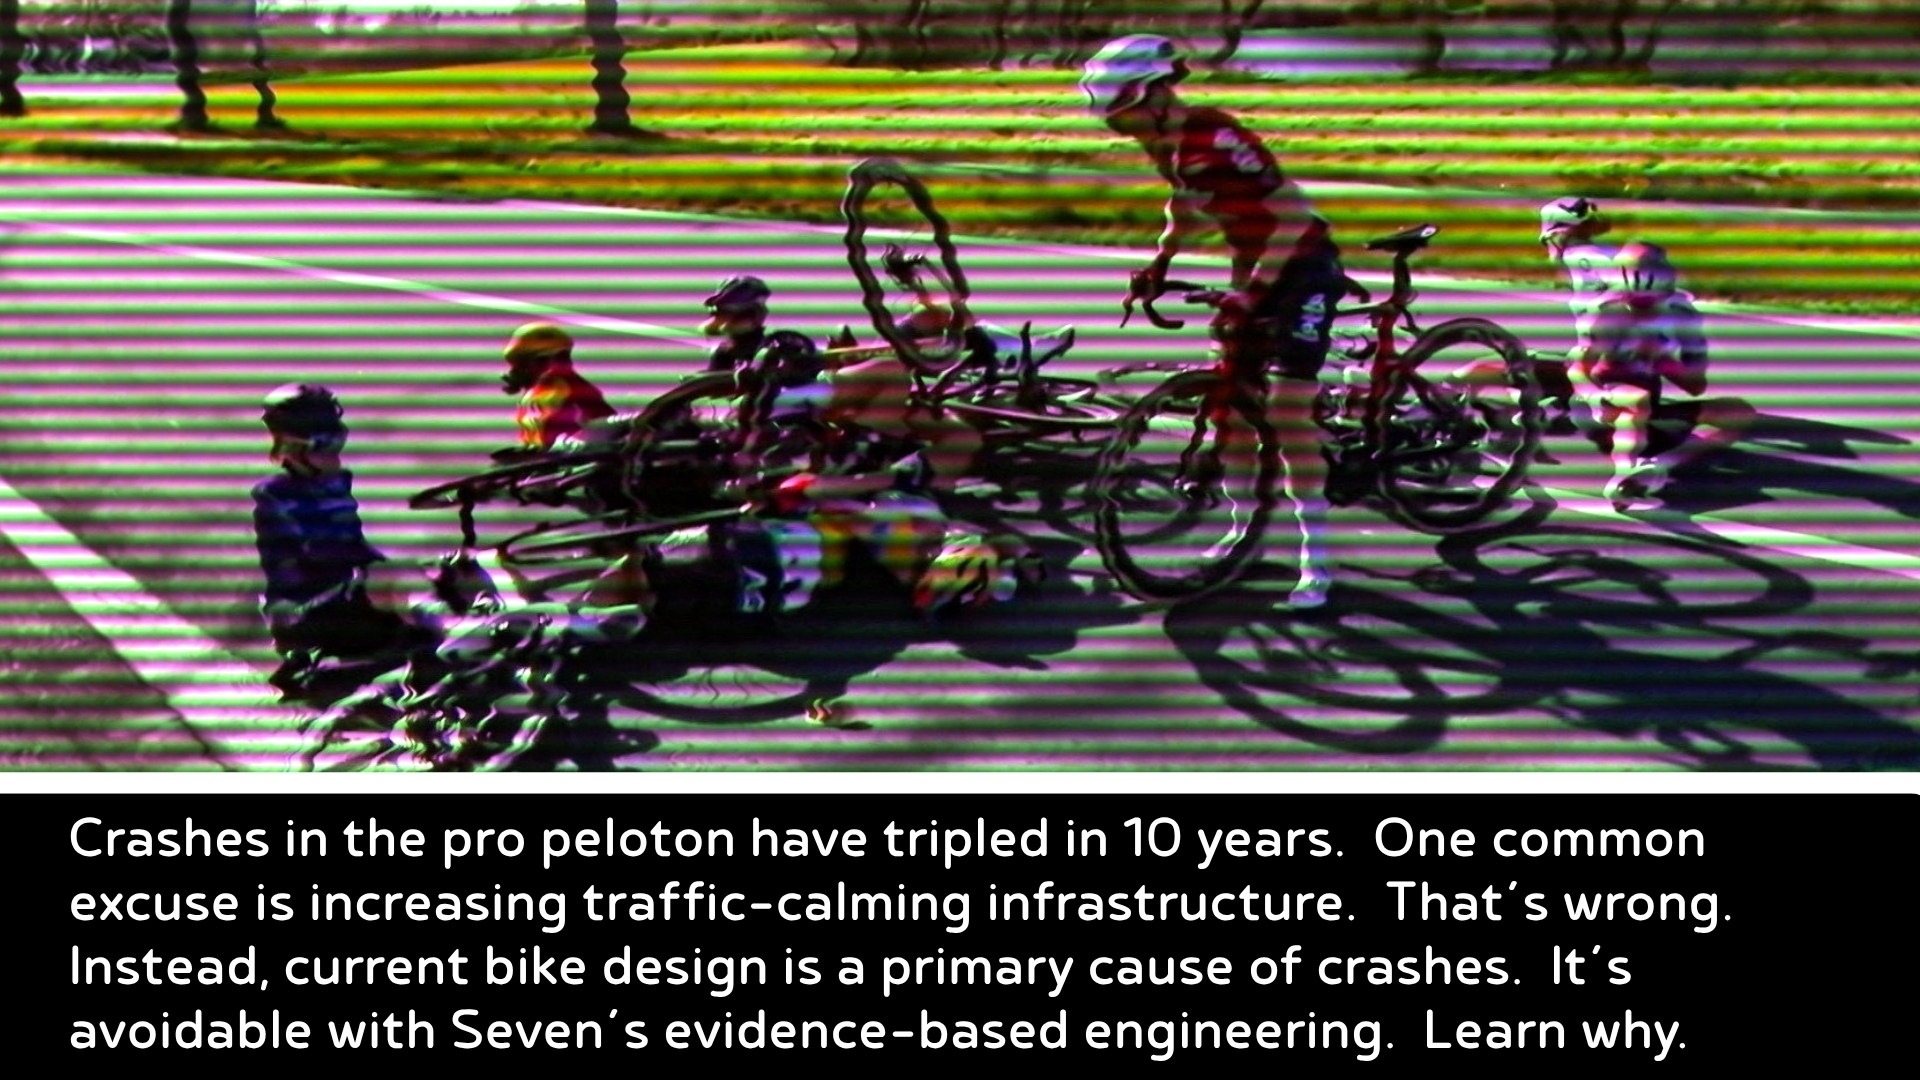
Rider injuries due to crashes have been increasing at alarming rates for over a decade. There are a few tropes about why this is. One of the popular cliches is that road furniture (traffic-calming infrastructure) is a primary culprit because there's more of it every year.
Collisions with road furniture in European racing are a serious problem. Some of the most brutal crashes seem to be with traffic structures.
More Furniture, More Crashes?
The growing number of road furniture is often cited as a primary reason for more crashes in the pro peloton. This connection sounds reasonable. However, the data does not support the idea that traffic infrastructure is both a significant contributor to rider injuries and a significant source of danger in the peloton. Figure 1 highlights the discrepancy between the data and the anecdotes of armchair race directors.
The traffic infrastructure problem needs to be dealt with and is one of the simplest causes of injury to eliminate for race promoters, host cities, and the UCI. The solutions aren't easy or a bargain, but they are clear.
Data Deficient
In almost all cases, public data is silent on any explanation for each collision. Seven has found three exceptions to this data desert. SafeR, the UCI's safety business, issued two press releases: one in 2024 and one in 2025. The third dataset is fatalities (there is usually more information about the cause of deaths due to their gravity). UCI website: "The UCI provides an update on SafeR's 2024 activities for safety in road races" Safer at the UCI press release: SafeR's activities for safety in road races for the first half of 2025
2024 Data
No public database exists with data on changes or increases in traffic furniture collisions over time. SafeR's data simply provides a snapshot for 2024 and 2025.
Even if there were zero infrastructure incidents a decade ago (highly unlikely), the increase would be at most 9% (from 0 to 29) in 2024. UCI website: "The UCI provides an update on SafeR's 2024 activities for safety in road races" That's not comparable to the 275% increase in all injuries over that same period.
2025 Data
Unfortunately, SafeR changed their datasets for 2025 and no longer show straffic infrastructure incidents as a separate line item. Safer at the UCI press release: SafeR's activities for safety in road races for the first half of 2025 So, no trend can be inferred.
The only analogous data is fatalities due to traffic structures. (Read Seven's article, "Fatalities In The Pro Peloton.") There have been two casualties related to infrastructure over the past 60 years: one in 2019 and one in 2025. Two datapoints are insufficient to draw any conclusions. However, the indication is that this kind of crash would increase if fatalities were to increase. Having said that, as we go back in time, the available information on loss of life becomes increasingly opaque, so it is likely that at some other point within the past six decades, infrastructure could have been an instigating cause.
Generous Reading Of The Data
SafeR's assessment of 9% is ambiguous because the language they use is "incidents [with] road infrastructure, including road furniture and traffic-calming measures." (Emphasis added.) The word "including" means that the 9% isn't exclusively road furniture. The term "incidents" is also cryptic, and an incident, as defined by SafeR, doesn't necessarily cause a crash or even an injury. Safer at the UCI press release: SafeR's activities for safety in road races for the first half of 2025 The ambiguous language could be a translation anomaly. Whatever the cause for lack of clarity, the reporting does not state that 9% equals injuries or crashes; it is some percentage lower. SafeR's summary encompasses all incidents involving all road infrastructure. Regardless, we use the 9% for Figure 1's 2024 data point because it is the worst-case scenario.
Increase In Traffic-Calming Infrastructure
For the data in Figure 1, Seven assumes a 200% increase in injuries caused by road furniture over the past decade. The doubling of a small number is still a small number. Whether road furniture injuries increased from 0 to 29 or 15 to 29 over the past decade doesn't change the basic conclusion that traffic infrastructure has a small impact on total injuries and collisions each year.
Seven can find no data on increases in spending or the quantity of traffic infrastructure in the EU or in any relevant country. The only vaguely correlated information is that, in general, it appears that the EU's investment in transportation infrastructure has remained static since about 2000. Investment in infrastructure in the EU From recovery to sustainable growth This provides a weak connection to answering the question of how much traffic-calming infrastructure has increased over the past decade.
Cause Of The Alarming Increase In Crashes
Many factors increase collisions every year. The foremost culprit is not increasing speeds, more racing, or traffic furniture. The primary cause of ever-escalating crashes is that bikes are increasingly difficult to handle and control. Read Seven's article, "More Crashes: The Cost Of Progress?" for a primer on the problem.
Footnotes
Footnotes for Figure 1
- 323 injuries in 2024: Hand-counted from publicly available injury data.
- Traffic furniture injuries were 9% at most. Source: UCI website: "The UCI provides an update on SafeR's 2024 activities for safety in road races."
- Seven assumed that infrastructure injuries would increase at the same rate as all injuries, at 275% from 2014 to 2024. A 275% increase in furniture injuries is 11 to 29. Even if the increase were twice as fast, the 2024 result would still be 29 injuries. Therefore, the starting furniture injuries would be 5. Regardless of the assumed percent increase, the endpoint doesn't change. The end point of 29 is all that matters.
- The road furniture injury data shown from 2014 to 2023 is inferred. We present the lines to show the likely increase in injuries each year, based on the single data point that SafeR made available.