
Carbon Fiber: Off-Axis Fibers Reduce Structural Strength
The majority of fibers in a carbon tube are just along for the ride
TL;DR
Carbon fiber is strongest when a tensile load pulls the fiber along its axis (0°). At 10° off-axis, fatigue strength drops by 67%, from about 550 MPa to about 180 MPa. At 90° off-axis, fatigue strength drops to about 35 MPa, a 94% loss. A bike frame requires strength in every axis, not just in the 0° axis. Lab numbers don't describe real-world performance.
Author | Rob Vandermark
Category | Engineering
Topics | Carbon Fiber, Fatigue Strength
This article is part of our Carbon Fiber Framebuilding series. Check out Seven's related articles.
The best case is half a case
Most published carbon fatigue data is generated using 0° coupons (test pieces or dog bones). A 0° coupon is a flat strip with every fiber running at 0° to the tensile-stress axis. That is the ideal way to test carbon fiber for maximum strength. The in-line tensile stress is also a use case a bike frame seldom sees.
“A composite material can exhibit significantly different strength along different directions.”
— Vassilopoulos and Keller, Fatigue of Fiber-reinforced Composites, Springer, 2011
A frame is loaded in bending, torsion, compression, and impact. Any single load hits most of the fibers at an angle or off-axis. So the useful question is how carbon holds up when the applied stress mimics real-world conditions. The Animation Layers-Stress illustrates the challenge.
How to read the animation
Six carbon prepreg plies, stacked together, represent how most carbon frames are built. Many high-end frames have fewer than six layers, sometimes only three. Fewer layers mean more gaps in stress management and therefore, worse performance and durability.
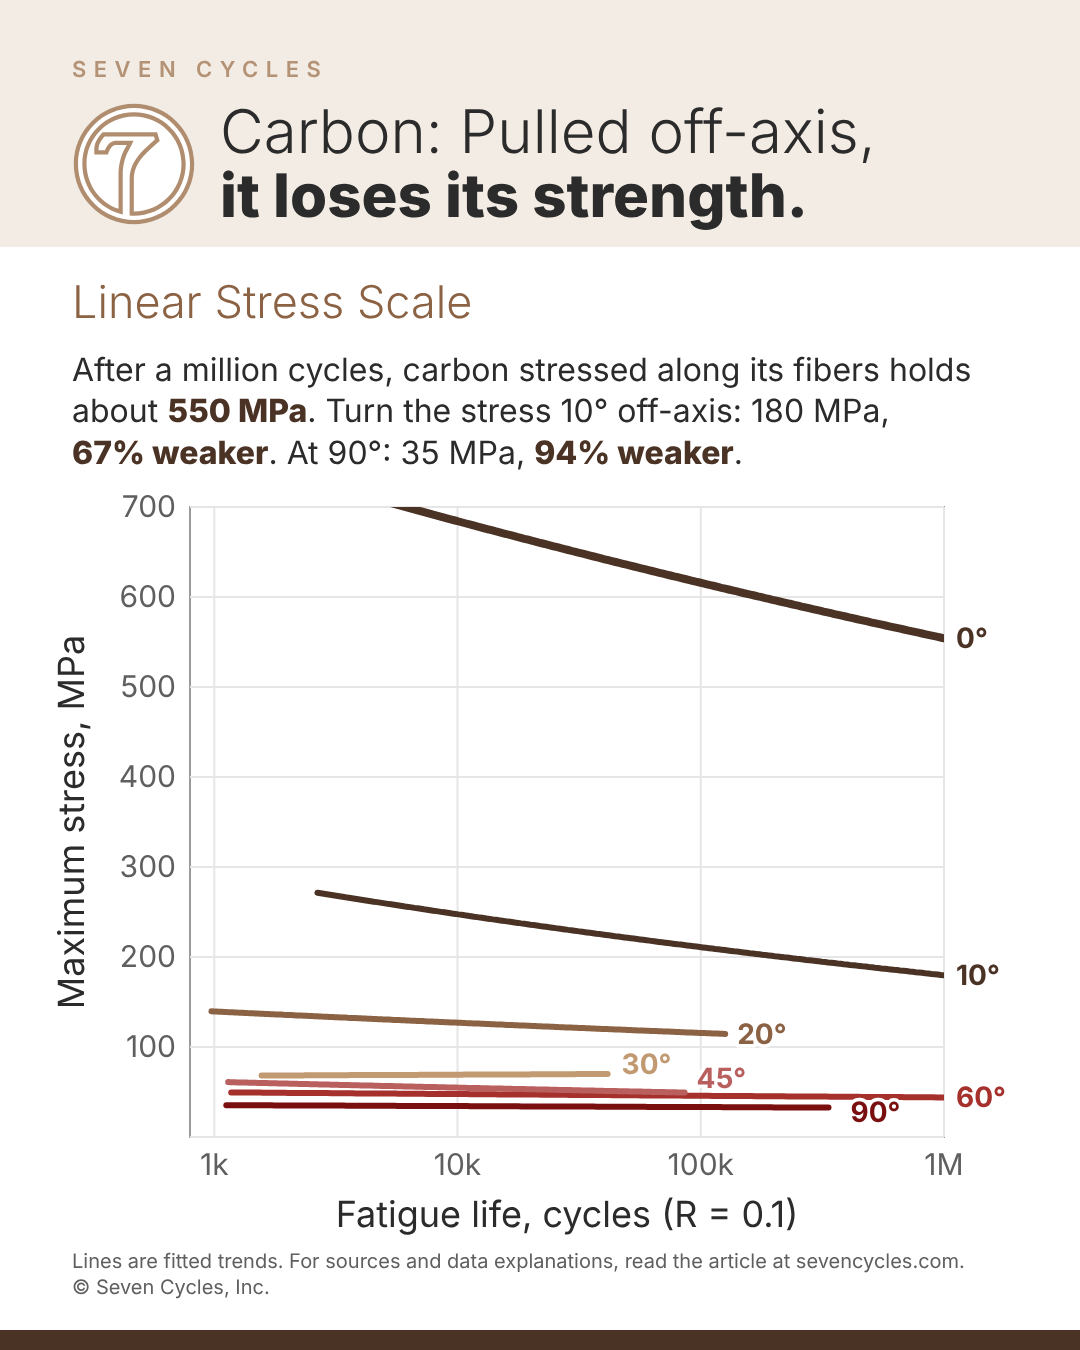
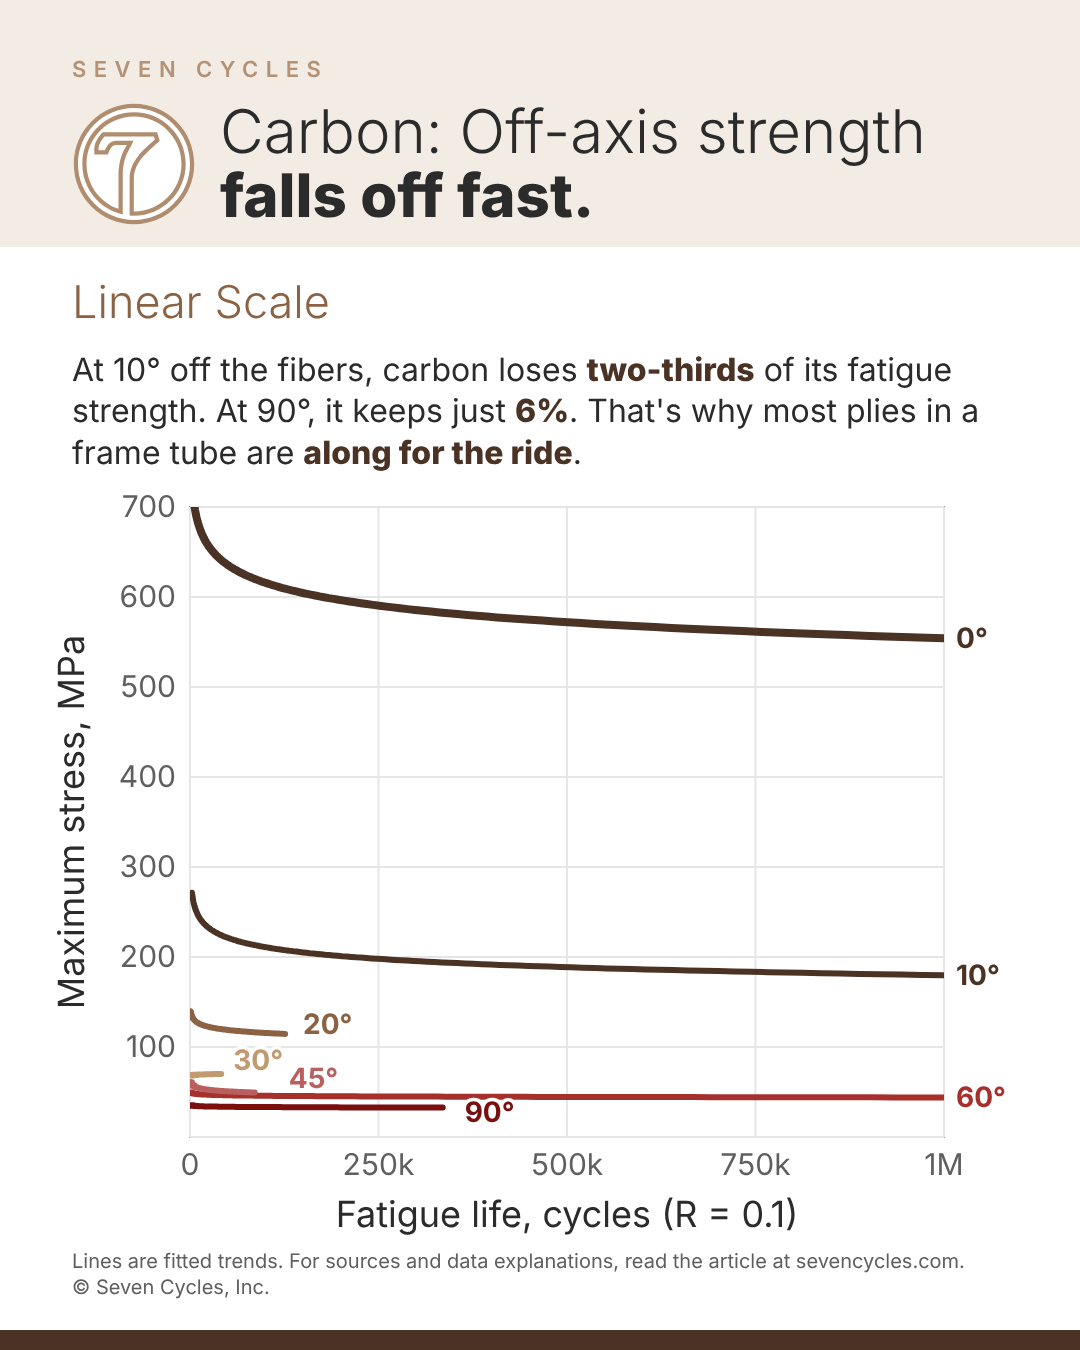
Each carbon layer is strong in only one orientation and only in tension (not compression). At just 10% off-axis, the tensile load drops by two-thirds. (See Figure Linear for data.) In other words, if the fibers are not perfectly in line with the stress, pedaling forces, for instance, the other five carbon layers provide little performance benefit.
By weight, only about 40% of the fibers are doing work. The other 60% is along for the ride.
Academic articles
A study by Awerbuch and Hahn answers the question by performing "fatigue tests on unidirectional carbon/epoxy specimens." J. Awerbuch and H. T. Hahn, (1981). Off-Axis Fatigue of Graphite/Epoxy Composite. Fatigue of Fibrous Composite Materials, ASTM STP 723, pp. 243-273, DOI 10.1520/STP27624S. Vassilopoulos and Keller reprint Awerbuch's data in Figures 6.3 and 6.4 of their 2011 textbook. We combined the two figures to create our two charts (Figure Log and Figure Linear). Vassilopoulos, Anastasios P. et al. (2011). Fatigue of Fiber-Reinforced Composites.
Data source Vassilopoulos, Anastasios P. et al. (2011). Fatigue of Fiber-Reinforced Composites. J. Awerbuch and H. T. Hahn, (1981). Off-Axis Fatigue of Graphite/Epoxy Composite. Fatigue of Fibrous Composite Materials, ASTM STP 723, pp. 243-273, DOI 10.1520/STP27624S.
Data source Vassilopoulos, Anastasios P. et al. (2011). Fatigue of Fiber-Reinforced Composites. J. Awerbuch and H. T. Hahn, (1981). Off-Axis Fatigue of Graphite/Epoxy Composite. Fatigue of Fibrous Composite Materials, ASTM STP 723, pp. 243-273, DOI 10.1520/STP27624S.
How to read the charts
Each line shows how carbon holds up under repeated loading at a specific angle relative to the fiber: 0° pulls straight along them, 90° pulls straight across. The horizontal axis is fatigue life, the number of load cycles before the coupon broke. The vertical axis is the peak stress in each cycle. Higher means stronger.
In the first chart, fatigue life on a logarithmic scale: each grid line is 10 times the previous one. Stress is on a linear scale. The second chart shows the same lines but with fatigue life on a linear scale. Most coupons broke within the first 50,000 cycles, so the off-axis lines crowd the left edge. Only the 0° and 10° lines run out to a million cycles.
What's behind the lines
The lines are fitted trends, not individual test results. We traced 55 coupon results from the book's Figures 6.3 and 6.4, 6 to 13 per angle. Vassilopoulos, Anastasios P. et al. (2011). Fatigue of Fiber-Reinforced Composites. We then fitted the standard fatigue curve, stress = A x cycles^-b, to each angle. Each line covers only the range of cycles where that angle was tested.
We left the individual test points off the charts so the 45°, 60° and 90° lines stay readable. The table below lists the longest-lived coupons at each angle.
The 0° line comes from a different source. J. Awerbuch and H. T. Hahn, (1981). Off-Axis Fatigue of Graphite/Epoxy Composite. Fatigue of Fibrous Composite Materials, ASTM STP 723, pp. 243-273, DOI 10.1520/STP27624S. The book publishes no 0° test points, only a fitted curve in its Table 6.2, and we drew that curve as given. Vassilopoulos, Anastasios P. et al. (2011). Fatigue of Fiber-Reinforced Composites. It may be low. (The book says tests ran at 50-70% of static strength, or 920-1,285 MPa at 0°. Yet the curve stays below 920 MPa across its whole range. If the curve is low, the real gap between 0° and the other angles is wider than shown. Below about 6,000 cycles, the 0° curve rises above 700 MPa and runs off the top of the chart.)
Tests stopped at one million cycles. Two coupons appear to have survived past that without breaking: one at 10°, at about 1.04 million cycles, and one at 60°, at about 1.19 million. Both are included in the fits but sit past the right edge of the charts.
The coupons were unidirectional AS/3501-5A carbon/epoxy. The researchers pulled the test pieces in tension-tension at R = 0.1 and 18 Hz. (R = 0.1 means the lowest stress in each cycle was one-tenth of the peak.) Values traced from the figures are accurate to about ±2 MPa.
What the data shows
Strength falls fastest in the first few degrees. Static strength drops from 1,836 MPa at 0° to 458 MPa at 10°. That is a 75% loss from a 10° turn.
Fatigue keeps the gap wide. At one million cycles, the 0° curve sits at about 550 MPa. The 10° line ends near 180 MPa, about one-third of that. The 90° line ends near 32 MPa at 335,000 cycles, about one-seventeenth.
Past about 30°, the resin and the resin-fiber bond limit strength. The fibers still break at final failure, but the resin gives out first. The 45°, 60°, and 90° results overlap at 25-65 MPa.
Static strengths come from the book's Table 6.2; the 10°-60° values were calculated, not measured. Vassilopoulos, Anastasios P. et al. (2011). Fatigue of Fiber-Reinforced Composites. We traced the fatigue values from Figures 6.3 and 6.4.
| Load angle to fibers | Static strength, MPa | Longest-lived coupons, approx. |
|---|---|---|
| 0° | 1,836 | About 550 MPa at 1,000,000 cycles |
| 10° | 458 | 193 MPa at 1,040,000 cycles |
| 20° | 211 | 100-130 MPa at 100,000-126,000 cycles |
| 30° | 129 | 60-78 MPa at 20,000-41,000 cycles |
| 45° | 94 | 51 MPa at 86,000 cycles |
| 60° | 70 | 43 MPa at 243,000-1,190,000 cycles |
| 90° | 57 | 35 MPa at 335,000 cycles |
Why this all matters for bike frames
A frame must withstand loading along nearly every axis. Pedaling induces torsional and bending stress in multiple planes through the bottom bracket. Add the bike chain, and stresses get much more complicated. No single fiber direction covers all of that.
Carbon framebuilders handle this complexity by stacking plies at several angles, often 0°, ±45°, and 90°. That covers stress in those directions, but only part of the fiber aligns with any single load. The rest is loaded off-axis, as in the coupons in Figure Log and Figure Linear above.
So a multi-axis laminate is weaker in fatigue along any one direction than a 0° coupon. A 0° fatigue test shows the best case. It is a real number, but a frame requires much more than that. When you see a carbon fatigue claim, ask what fiber angle was tested. If the answer is 0°, the number describes a strip of fibers, not a frame.
Titanium behaves differently. Wrought titanium tubing is nearly equally strong in every direction, so its test data apply to loads at any angle.
Caveats
- These are unidirectional coupons, not multi-axis laminates or frame tubes. They show how each ply behaves off-axis, not the fatigue strength of a finished laminate.
- Sample sizes were small: 6 to 13 coupons per angle. The original authors called them too few for statistically meaningful S-N curves.
- The textbook calls the high-angle data low quality. The 45°, 60° and 90° results overlap.
- We traced the fatigue values from the book's figures, and they are accurate to about ±2 MPa.
- The 0° curve is the book's fit, with no published test points, and it may be low (see "What's behind the lines" above).
- The coupons were loaded in tension only (R = 0.1). Frames also see compression and reversed loads.
- The material is a 1981 aerospace carbon/epoxy. Modern fibers and resins differ, but the angle effect remains.